

Shadi Eskaf is a Senior Project Director for the Environmental Finance Center at the University of North Carolina.
Previous blog posts (here and here) discussed the fact that per capita water consumption is declining. The financial ramifications can be significant, since charges for customer sales constitute the single largest source of revenue for water utilities. Has the downward trend in water consumption translated into declining revenues for utilities? Anecdotally, we have heard from several utilities in Canada and the United States that the decline in water use has caused revenues to fall short of projections in recent years. Analyzing how revenues for 2,838 utilities changed from one year to the next in six states spread across the United States helps answer the question of whether revenues are declining.
As part of the research for Water Research Foundation project #4366, we (the Environmental Finance Center at UNC and Raftelis Financial Consultants, Inc.) collected and analyzed financial data for local government water and wastewater utilities from state agencies in California, Georgia, North Carolina, Ohio, Texas and Wisconsin. The agencies collect financial data for water utilities for different reasons, either to monitor the financial health of utilities, assess their ability to pay back loans made by the agencies, or to financially regulate water utilities as is the case in Wisconsin.
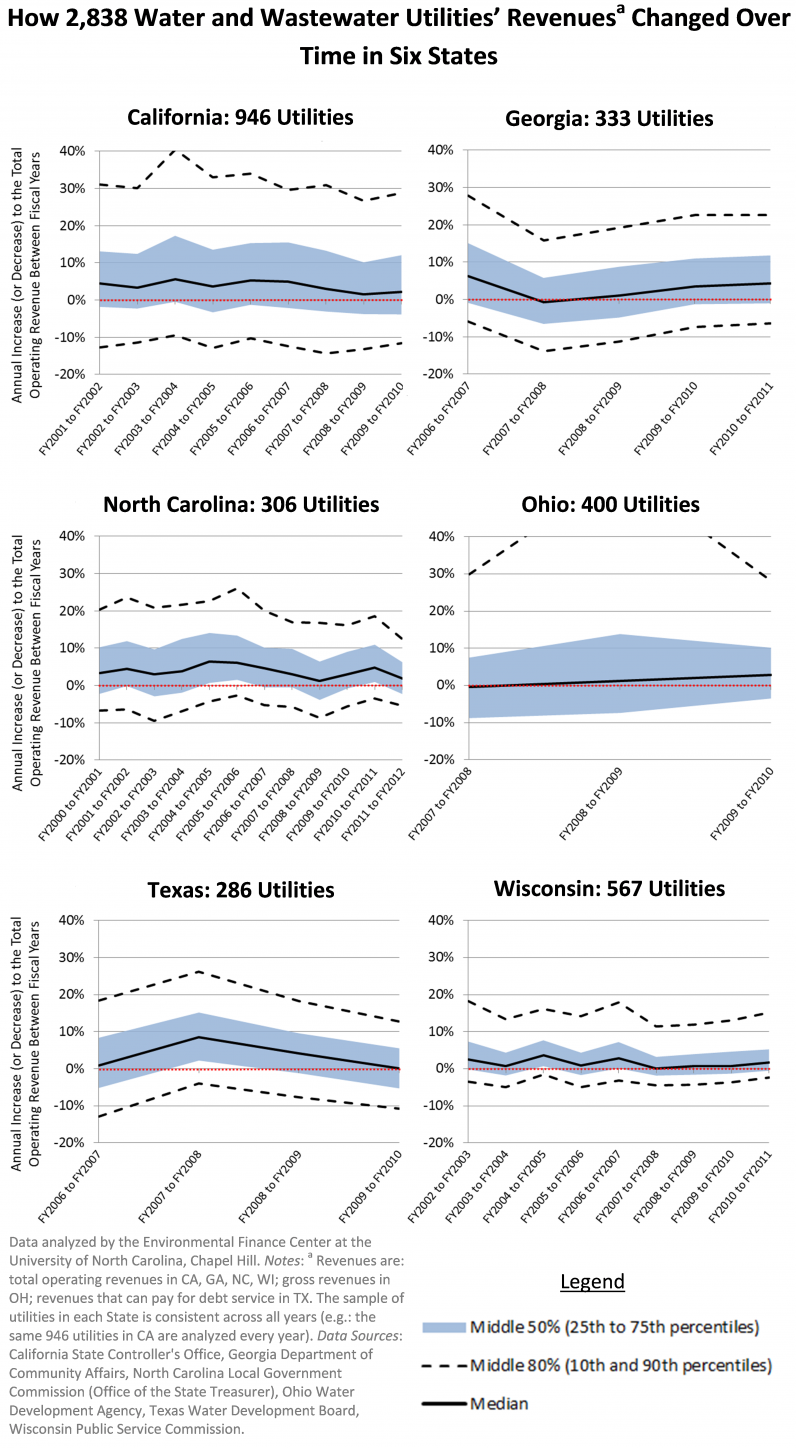
Trends in operating revenues between Fiscal Years 2000–2012 for 2,838 utilities in these states are shown in the figure below (please click on the image to enlarge to full size). The study period for each state is unique, based on data availability. Each utility’s revenues were tracked over time, and changes from one year to the next were computed. The ranges of changes across all utilities in the state are then summarized in the figure for each year. The sample of utilities is consistent across all years. For example, in California, the median change in total operating revenues among 946 water municipalities and special districts between FY2001 and FY2002 was an increase of 4.5%. Between FY2009 and FY2010, the median change was an increase of 2.2% for the same 946 water municipalities and special districts.

How 2,838 Water and Wastewater Utilities’ Revenues Changed Over Time in Six States
In all of the states, the median change to operating revenues were almost always zero or positive, regardless of year. This indicates that, from year-to-year in the past decade, operating revenues for at least half of the utilities increased, despite a downturn in the economy, severe droughts and changes to customer water use patterns.
The rate of increase to utilities’ revenues has not been consistent over time, however. In particular, the rate of increase to utilities’ revenues decreased in the later years of the decade. In California, the median increase dropped from about 4.5%/year in FY2002 – FY2007 to about 2.2%/year in FY2008 – FY2010. In North Carolina, the median increase to total operating revenues averaged around 3.6%/year in FY2001 – FY2004, increasing to 5.7%/year in FY2005 – FY2007, and then halving to 2.8%/year in FY2008 – FY2012. In Wisconsin, the median increase see-sawed every year around an average of 2.1%/year in FY2003 – FY2007, and then steadied at a near-zero average of 0.8%/year in FY2008 – FY2011, although with very slight increase over time. Among the three other states with shorter study periods, similar low median rates of increases to total operating revenues are observed in FY2008 – FY2010.
The figure shows the ranges of annual changes to operating revenues in addition to the median lines, reflecting the magnitude of annual increases or decreases to revenues across the middle 50% and middle 80% of utilities in the state. These ranges rise and fall over time similar to the median line, reflecting that greater portions of utilities saw their operating revenues grow more slowly between FY2008 and FY2010.
In fact, a significant and growing portion of utilities experienced decreasing operating revenues in those years. The percent of utilities that had lower operating revenues in one fiscal year than in the preceding fiscal year in the six states is shown in the next figure. In any given one-year period between FY2000 and FY2012, operating revenues decreased for 16% to 52% of utilities in those states, which is a significant proportion of utilities, considering that costs general increase every year. Although the percent of utilities with declining revenues varies significantly from one year to the next, in general more utilities in all states, except Texas, had a decline in operating revenues during Fiscal Years 2008 and 2009. In Georgia and Ohio, for example, nearly half of the utilities experienced a decrease in operating revenues during FY2008. For states with more recent data, it appears that annual changes to operating revenues generally improved starting in FY2010, with the exception of FY2012 in North Carolina.
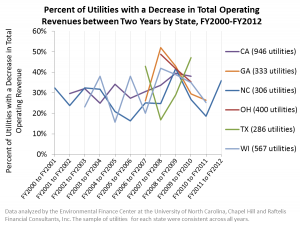
Percent of Utilities with Declining Revenues
Based on these results, it is clear that water utilities experienced at least a slowdown of revenue increases in recent years, if not actually declining revenues. Costs continue to rise in the meantime, leaving utilities with fewer resources to put into infrastructure replacement and renewal than in previous years. Next, we compared utilities’ annual revenues to their expenses and tracked changes to these ratios over time.

0 Comments
2 Pingbacks