

Jeff Hughes is a Faculty member at the UNC School of Government and the Director of the UNC Environmental Finance Center. Jeff is also the Principal Investigator for the Water Research Foundation’s “Defining a Resilient Business Model” Project (#4366).
Conventional wisdom among many water managers is that the price of water and wastewater service is a bargain and customers should not have difficulty paying their bill. Even in areas with higher priced water services, managers seek solace in the fact that the price of water services still tends to compare favorably to the price of non-essential services such as cable. These views can be supported in most service areas by citing the most common affordability metric, the percentage of a community’s annual median household income (MHI) spent on water services over a year.
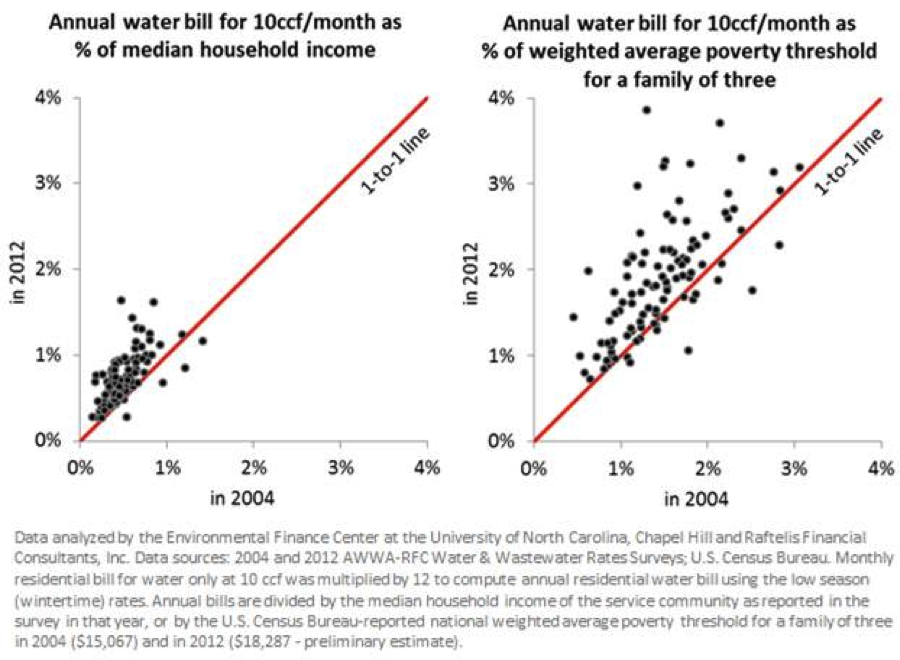
Despite the challenges in calculating it, percent of MHI spent on water is still the most widely cited metric in assessing affordability pressures. While there is no universal threshold for this indicator, funding programs and regulating agencies typically speak of “affordability” levels in the range of 1 to 2 percent of MHI for water service, and twice that for water and sewer service. The two side-by-side charts below show expenditure trends for a group of utilities that participated in both the 2004 and 2012 AWWA-RFC rate survey. The chart on the left side shows how the percent of MHI spent on water (wastewater not included) has evolved by comparing 2004 directly with 2012 numbers. The chart shows that in 2012, almost every utility in the sample asked their service area to pay a greater percent of their income on water services than in 2004. However, while the percent of income devoted to water has increased it still remains below 2% for all of the utilities.
Community wide MHI has several shortcomings as a water affordability indicator — it masks income distribution within a community and discounts the low-income part of a community curve. For example, a single parent with two children that makes just over minimum wage will earn less than $20,000 per year and be on the edge of the poverty level. These types of distressed families make up a percentage of almost every community, regardless of the community’s overall aggregated MHI. A low income family in living in a community with a MHI of $75,000 or one living in a poorer community with a MHI of $30,000 will experience the same affordability challenges. The chart on the right of the figure below shows the percentage of a family of three’s income living at the poverty level that went to water service for 2004 and within the same utility sample. The analysis highlights the evolution of spending pressure for low income families over the last 8 years with many families that had been paying less than 2% of their income in 2004, now paying 3% or higher.
The figure above is based on utilities that participate in the national AWWA-RFC survey and focuses only on water sales. This survey is the most prominent national survey on water pricing and includes many of North America’s largest utilities. Other rate surveys carried out at the state level include smaller more rural utilities and provide additional insight on the challenges facing utilities serving very low-income communities. The figure below shows two affordability metrics (expenditure percent of MHI and percent of $20,000 household income) against each other for utilities during 2012 in the state of North Carolina. The survey also includes both water and wastewater services. The first thing that becomes apparent in this analysis is that many more utilities than in the national survey have customers paying a much higher percent of their income on water and wastewater in 2012. The chart also shines light on potential affordability pressures facing utilities that have a more affluent overall customer base but still are asking their low-income customers to pay a sizable component of their income for water and wastewater.
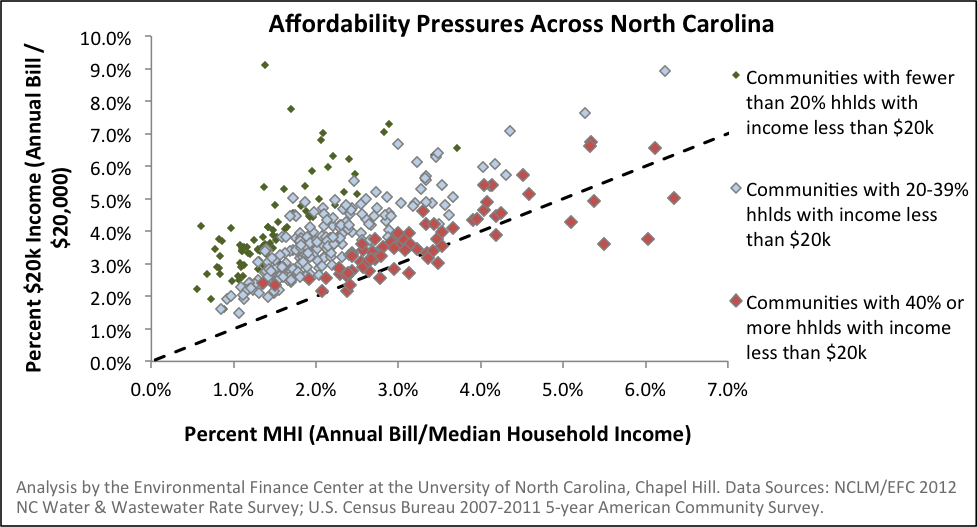
Cable may still cost more than water in most communities, but that doesn’t make it any easier for the low income families paying as much as 7 to 10% of their income on water and sewer. Many utilities have responded to these trends with some type of affordability initiative. While nationally, water service still does seem to be relatively inexpensive, addressing the financial impacts of water service on low-wealth families in many communities has become both a public policy issue and a financial issue; as distressed families have more difficulty paying bills, the amount of late payments and disconnections go up. In addition, as it becomes clear that some families are unable to pay for basic services, the pressure on elected boards to keep rates low for the entire customer base increases.

Very interesting Article, thanks author..