


David Tucker is a Project Director at the Environmental Finance Center at UNC Chapel Hill.
How affordable are electric rates for “average” or “typical” residential customers in North Carolina? That is a complicated question to answer, and this article represents only a beginning to that investigation.
As the UNC Environmental Finance Center has almost completed a statewide survey of residential electric rate structures (with 103 out of 105 utilities responding for a 98% response rate) as part of a project funded by the Z. Smith Reynolds Foundation, this is a question that interests us considerably as we update our work on residential electricity rates and pricing in North Carolina. And at a time when the U.S. Energy Information Administration (EIA) is forecasting that the rising cost of generation fuels such as natural gas will cause the U.S. residential price of electricity to increase 2.2% from 2013 to 2014, to a national average of 12.4 cents per kilowatt-hour (kWh), followed by an additional 1.9% increase from 2014 to 2015, this could be a concern that is on many people’s minds nationwide. Indeed, here in North Carolina, where Duke Energy Progress and the North Carolina Eastern Municipal Power Agency (NCEMPA) are discussing the possibility of Duke Energy Progress purchasing NCEMPA’s electric generating assets, customers may be wondering what such a sale could mean for their future electric rates.
One way to look at the affordability of an electric bill is in a sort of abstract sense of where your state’s rates are in comparison to those of the country as a whole. For example, 2012 U.S. EIA data on average monthly residential electric bills show the following:
2012 Average Monthly Electric Bills – Residential
| State | Number of Customers | Average Monthly Consumption (kWh) | Average Price (cents/kWh) | Avg. Mo. Bill ($) |
| North Carolina | 4,230,588 | 1,077 | 10.91 | $117.45 |
| U.S. Total | 126,832,343 | 903 | 11.88 | $107.28 |
Electric rates in bordering states are similar to North Carolina’s: 10.64 cents/kWh in Virginia and 11.05 cents/kWh in South Carolina. Rates in various locales are affected substantially by the generation mix, as some electric power technologies are more costly than others.
PERCENT MHI
However, while North Carolina residential electric bills may appear “more affordable” than the national average, this really tells us nothing about how affordable the electric bill is in terms of the average customer’s ability to pay. One way of looking into this complex question is to look at what we call Percent MHI, which is calculated as a year’s worth of residential electric bills for a given utility’s service area divided by the median household income (MHI) for the analogous census area. The MHI data is collected by the U.S. Census Bureau, using their Five-Year American Community Survey from 2008-2012. The resulting percentage can be interpreted as “the household that is half-way in the spectrum of all households in terms of income is spending X% of their annual income on electricity.” It thus follows that half of the customers spend less than X% and half spend at least X%. My colleague at the EFC, Shadi Eskaf, has written a great blog post on this subject as it relates to water and wastewater rates, including the limitations of using this approach as a measure of residential customer affordability.
For example, using 1,000 kWh/month as a consumer’s average monthly consumption, we can calculate an average consumer’s bills by summing up the base charge (also called a user charge, minimum bill, basic charge, customer charge, basic facilities charge, etc. – usually for single phase electric service) and the volumetric charge (the energy charge for the kWh used; also called an energy consumption charge, usage charge, etc.). For the purposes of this analysis, we will not include any riders, taxes, or fees – though we did track the residential electric riders in our survey. Also, for the small handful of N.C. residential electric rate structures that include a component for demand charges (i.e. for the power demanded, as measured in kilowatts (kW)), that element is not reflected here, for simplicity’s sake. For example:
($145.50/month X 12 months/year ) / $37,759 MHI/year = 4.6% of MHI spent on a year’s worth of electric bills at 1,000 kWh/month
This average customer bill is then compared to the MHI of the region in the utility’s territory. Of the 99 utilities that we were able to match to corresponding MHIs, the minimum MHI was $16,447, and the maximum was $89,398. The Census Bureau reports that the statewide MHI was $46,450. The monthly bills themselves, and the Percent MHI of those bills, ranged widely across the state’s residential electric utilities:
Ranges of N.C. Residential Electric Bills at 1,000 kWh/month for 2013 Warm and Cool Season Rates
| Warm 1000 | Cool 1000 | |
|
min |
$71.21 |
$71.21 |
|
max |
$182.00 |
$182.00 |
|
median |
$128.68 |
$127.32 |
|
average |
$129.58 |
$127.55 |
|
count |
103 |
103 |
Ranges of Percent MHI for N.C. Residential Electric Bills (2013 Rates)
| Warm 1000 as % of MHI | Cool 1000 as % of MHI | |
|
min |
1.58% |
1.39% |
|
max |
10.48% |
10.48% |
|
median |
4.31% |
4.30% |
|
average |
4.53% |
4.48% |
|
count |
99 |
99 |
SURVEY RESULTS: 2011 VERSUS 2013
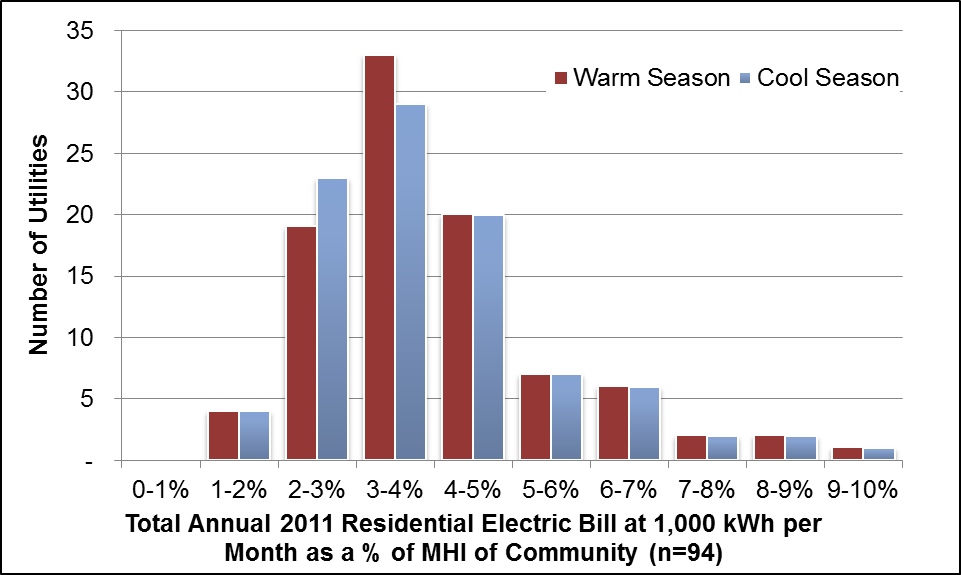
Going back to the U.S. EIA forecast of a trend of rising electric rates in 2014 and 2015, it is interesting to look at how the Percent MHI may have changed for our survey of N.C. 2011 electric rates versus our current survey of 2013 electric rates. With the caveats that (a) the exact responders to the survey are largely the same, and (b) that these calculations are not weighted by service population, number of connections, or any other weighting, it is interesting to see a similar trend of rising Percent MHI:
Total Annual 2011 Residential Electric Bill at 1,000 kWh per Month as a % of MHI of Community (n=94)
Total Annual 2013 Residential Electric Bill at 1,000 kWh per Month as a % of MHI of Community (n=99)
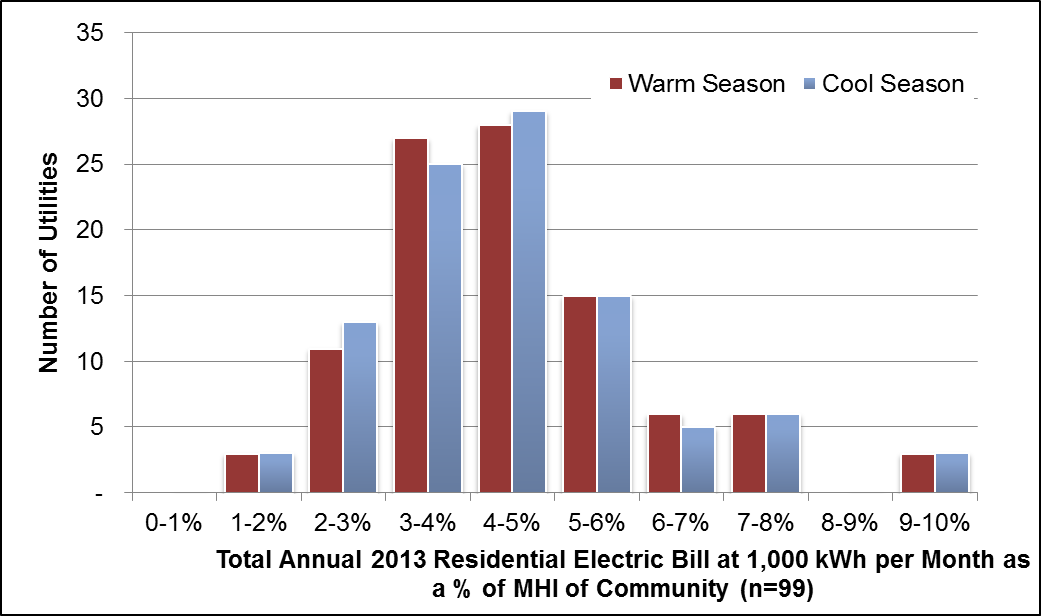
Note that the largest category in 2011 (3-4% of MHI) has now been slightly eclipsed in 2013 by the 4-5% category. The overall rightward shift in the percentages from 2011 to 2013 does seem to indicate a declining affordability of residential electric bills for typical customers. That said, questions about this analysis remain, such as to what extent are the percentages going higher due to rising bills versus potentially declining MHI? Or due to a slightly different mix of survey responders? (Note that the three large investor-owned utilities (IOUs) in North Carolina were included in both surveys.) Without going into a utility-by-utility analysis, we can see that the state level MHI from the U.S. Census Bureau survey (the Five-Year American Community Survey from 2006-2010) used to calculate the first graph above was $45,570, or $880 less in 2011 than in 2013. If this trend of rising MHIs from 2011 to 2013 (the denominator) were to hold throughout the state’s electric utilities, then rising rates (the numerator) would seem to be the primary cause of the rising Percent MHI.
As the affordability of residential electric rates is a meaty subject, further research is indicated. For example, how do the rates and Percent MHI of NCEMPA customers compare with those of the IOU’s? Or NCMPA1 customers? Or Electric Membership Cooperative (EMC) members? And on another topic, where financial reporting is available, how are these utilities doing with their operating ratios and investment in their capital improvement funds? Once our survey of 2013 N.C. residential electric rates is completed, look for an update to our online interactive dashboard tool, which allows users to look at a variety of benchmarks for the rates and financial health of these electric utilities. In the meantime, feel free to consult the 2011 version of the tool here; and look for the updated tool in the coming month.
How affordable are NC electricity rates? http://t.co/U9xcbGhDTg @NCGrowth
— Envr. Finance Center (@EFCatUNC) February 19, 2014

Hi David,
Thanks for the interesting analysis. You may also be interested in a rather different interpretation of energy affordability – the idea of energy poverty. Here is a link to a paper I coauthored with Jeff Popke at East Carolina University while a masters student there. It is focused on eastern NC, and I have continued examining the utilities there for my dissertation research at UNC in the Dept of Geography.
http://www.tandfonline.com/doi/abs/10.1080/00045608.2011.569659?journalCode=raag20#preview
Conor