
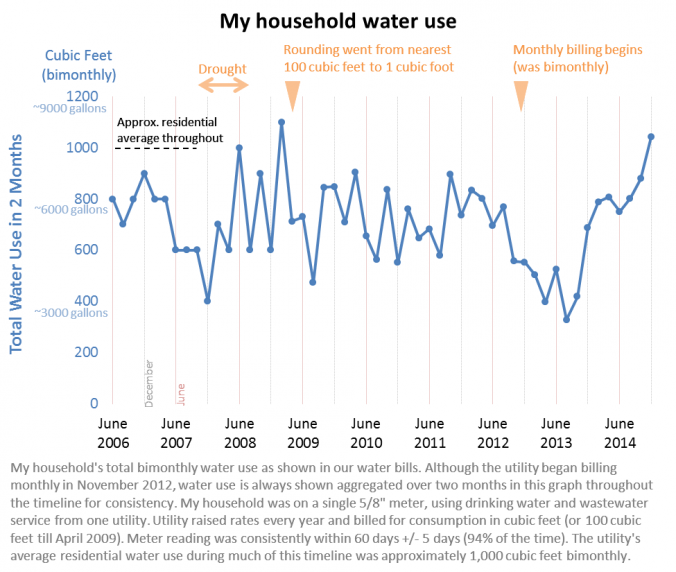

Are you up for a challenge? I have disclosed in this graph my own household’s water use between June 2006 and December 2014, as reported on my water bills. Without any more information about my household’s characteristics (except that it is residential, on a single 5/8″ meter, and using drinking water and wastewater service from one utility), this is the extent of knowledge that my utility has about my household. Yet, my water use data – which are present in the utility’s billing records – reveal much about my household. My challenge to you is to look at this graph and identify as many interesting characteristics about my household as you can. Think about it, too, from the perspective of how the utility should interact with my household. Here are a few questions to consider to get you started:
- How does my household water use compare to that of other residential customers at this utility? What does that hint about my household’s characteristics?
- What do the peaks and valleys in my water use reveal about my household’s water use habits?
- Are there any significant changes to my household’s “typical” water use? What could have caused them?
- Did my household’s water use change as a result of the utility’s changing practices or prices? What may have influenced this?
- How should the utility interact with my household when it needs to encourage water use conservation?
- What kinds of changes to the utility’s rate structure would affect our household’s water use (and bill) and what kinds would not?
Here is a little more context about the utility. The utility serves over 260,000 people in an urban city in North Carolina. The utility raised rates every year (usually in July), but the rates are relatively low compared to others in the state. During a severe drought between October 2007 and summer 2008, the utility implemented mandatory restrictions and bans on outdoor water use and educated their customers about water use conservation.
If you decide to take this challenge, please feel free to share with us your thoughts, observations, guesses and questions in the Comments below, in a private email to me, or just take notes. If you would like a hint and a sneak peak, consider reading “A Guide to Customer Water-Use Indicators for Conservation and Financial Planning” (free AWWA guidance document).
I reveal answers in the next blog post and discuss how this applies to utility management.

Here are my guesses : Your family usually takes a vacation in July and December. I am guessing you had a baby or some other addition to your family in Fall of 2011 and December of 2013. Either that or you added a hot tub or pool. Can’t wait to see if I am right…
Hi Tobin,
Thank you for being the first to put forth your thoughts! I’m very happy that you accepted the challenge and tried to solve this puzzle. Hopefully, you’ve had a chance to read my “solution” in the next blog post: https://efc.web.unc.edu/2015/03/27/solving-the-puzzle-understanding-customers-through-their-water-use-history/
In response to your guesses: you are right about our family taking vacations in the summer (usually around July) and December! The dips in water use around those times are a little more evident in the next blog post where I colored the summer months in red. Unlike most customers, our household used less in the summer, on account of my wife and I going away on vacation then.
As for the baby or new addition to the family – that wasn’t quite right. Instead of reading the graph as an increase in consumption in Fall 2011, it’s more accurate to see it as a decline in use after summer 2012. That’s when my wife went to a different city for work, halving our household size in NC. She returned later, explaining the usage returning to normal levels late on.
Thank you again for offering your thoughts. Please feel free to comment on any of our blog posts in the future. Also, have you thought about graphing your own household’s water use?
I don’t see a consistent increase in summertime usage, so I’m guessing you either a) don’t do much gardening or lawn watering, or b) do utilize rain barrels.
Hi Kerby – thank you for your comment. You’re correct that our summertime use did not go up, and your guess is spot on: we didn’t do much (actually, any!) gardening or lawn watering. We lived in a townhouse with no yard then. Looking for seasonal demand fluctuations is a great way for a utility to identify which households may have irrigation systems. Identifying those customers can help ensure that backflow prevention devices are installed where they need to be, as well as monitoring water resources during peak demand periods.
I’ve posted the solution to this puzzle on the next blog post: https://efc.web.unc.edu/2015/03/27/solving-the-puzzle-understanding-customers-through-their-water-use-history/ In it, I mention the lack of outdoor watering, as well as other observations one can make about our household from this graph.
What a fun game! Thanks for the puzzle! 🙂
Your bimonthly household water use appears to average around 700 cubic feet over this roughly 8.5-month period of record. Your bimonthly household water use is about 300 cubic feet less than the ~1,000 cubic feet average residential bimonthly use for this utility (based on the population cited, I’m guessing Greensboro). Your lower-than-average household use could derive from a number of factors, including but not limited to: (a) fewer than average denizens; (b) short-showering denizens; (c) abnormally water-efficient appliances; (d) abnormally tight pipes; (e) rain barrels or other water-amending / water-recycling technologies; and/or (f) xeriscaping.
The peaks and valley in your households water use suggest a few interesting patterns. First, only one of the highest peaks (i.e., near or above 900 cubic feet) occur in June or August, suggesting your household does not use a lot of water for outdoor watering of landscaping, summer vehicle washing, slip-and-sliding, or pool filling. Either that, or your household is conserving – albeit fleetingly – in response to, or anticipation of, the usually-July rate increases. The one 900+ June record was at the tail end of the 2007-2008 drought, so maybe some emergency landscape watering here, despite – or in rebellion against! – the mandatory restrictions / bans and customer education?! I’m puzzled as to why your usage spikes are mainly in the winter months: perhaps you have an urban ice skating rink out back? Smoothed by a thirsty Zamboni? Or maybe a snow-making machine?
Your household’s water use was also noticeably more erratic in 2008 and early 2009 compared to the rest of this record, suggesting – perhaps – sporadic houseguests and/or family additions/departures?! Alternatively, or in part, the apparent erraticism in 2008 and early 2009 may be an artifact of the 100-cubic-foot billing prior to April 2009.
Your household’s water use was particularly low for about a year right after the switch to monthly billing cycles, although still exhibiting the August low; maybe your household – or most members thereof – went on an extended vacation or sabbatical during this time? Or maybe the monthly bills spurred some significant conservation (which apparently wore off in 2014)?! Maybe the annual rate increases that took effect July 2012 were particularly severe, spurring some dramatic and relatively enduring conservation?
Regarding how the utility should interact with your household when it needs to encourage water use conservation: do whatever they did in late 2012 and early 2013! And don’t do what they did in response to the 2007-2008 drought!
* roughly 8.5-YEAR period of record * duh!
Brian, well done! That was a very well-thought out response and a comprehensive answer! I am glad you enjoyed the puzzle. I revealed my solutions, as well as implications for doing this exercise for utility financial management, in my next blog post: https://efc.web.unc.edu/2015/03/27/solving-the-puzzle-understanding-customers-through-their-water-use-history/
You were spot on in many of your observations. Our average household water use was lower than the average at the utility. You even ventured good guesses as to why that might be, and the first guess was the most accurate one: we only had two people in our household throughout this time. We also lived in a townhouse with no yard, so we didn’t water a lawn or use much outdoor water (something else that you figured out), and the townhouse was new construction, so the pipes were in good shape and all of the appliances were water efficient (at that time). We also would like to think that we are short-showering denizens, but I can’t say that I’ve ever timed myself to compare!
The June 2008 spike was simply a result of the utility rounding bills to the nearest 100 cubic feet at that time. It was not the result of any emergency watering during the drought, or rebellion against restrictions. In fact, the mandatory restrictions during the drought had no effect on our water use because we didn’t water outdoors in any case: one of the key points I make in the next blog post. (Our water use seeming “more erratic” in 2006-2008 was also a result of rounding – once the utility switched to billing at single cubic feet in 2009, our recorded water use looked more realistic).
As for water use spiking more in the winter than in the summer, I think Tobin probably guessed best: in most summers, my wife and I traveled on holiday, so our water use dipped in the summer, thus making the wintertime use seem like a “peak” by comparison. If you happen to know someone who is willing to install an ice skating rink at the back of our house for very cheap, please let me know!
You’re correct again about the temporary dips in our water use in two different periods, most notably in 2012-2013. That was a result of my wife moving away to a different city for work temporarily, nearly halving our household water use in this house. It was purely coincidental that this occurred at the time when the utility switched to monthly billing. Although there has been research and evidence of average household water use being lower at utilities that bill monthly compared to at utilities that bill bi-monthly or less frequently (including a study that we conducted in NC), the billing frequency had no effect in our household, partly because we were already low water users to start. Similarly, the rate increases every July did not affect our usage much – rates were (and still are) relatively low compared to other utilities across the state.
Thank you again for such a detailed, thoughtful response. Please feel free to comment on any of our blog posts in the future.
Hi Shadi,
This is great! You can learn a lot from a simple graph. I run a company called MeterHero, which helps people track their water and energy use (and pays them cash rebates when they conserve). We look at this type of data every day!
I don’t have your exact numbers, but estimating based on your graph, you have averaged about 86 gallons per day of water over the past two years. Your usage is not very seasonal (well, it’s higher in the winter…that’s rare), so it suggests that you have probably no more than four people in your house, more likely three. In the past three billing cycles, however, your usage has increased dramatically. You’re closer to 115 gallons per day – a 30 gpd increase. This is typical of a leaky toilet, a new baby, or some new plants you are trying to grow.
I would like to know if you felt like you were in control of how much water you used. Were you surprised by the fluctuations in your usage? Did you want more granular data to figure out what was causing these aberrant totals?
Hi McGee,
Thank you for your comment, and I’m glad you enjoyed this blog post and participated. I have a small touch of envy that you get to look at this type of data day in and day out!
Your estimate is very close. In the years when our household size did not change, our average water use was about 89 gallons/day. That’s nearly 45 gallons per capita per day in our household. Although low, I think there may have been some room to lower our use a bit more. How does that per capita use compare to other residential customers you’ve analyzed?
You were right about our summertime water use not increasing. We didn’t have a lawn to water so our outdoor water use was nill. The increase in 2014 was the result of our household size increasing, or more accurately returning to its usual levels. Between 2012 and 2013, our household size decreased when my wife moved for work. Thankfully, we didn’t have a leaky toilet!
My wife and I felt in control of our water demands. We only used water for washing, cooking, flushing, and drinking. I suspect the washing machine and dishwasher were our biggest water-using appliances, and so we were in control over much of our water use. The biggest surprise I had was simply how “choppy” our bi-monthly water use seemed, with peaks and valleys every other cycle. It isn’t a very smooth graph, even after the utility switched to rounding at the nearest 1 cubic foot level. Part of that, I think, can be explained by our work travel schedules that saw one of us leave the house for a week or more at a time at irregular periods, and also because our use of the appliances varied greatly from week to week.
If you would like to read about other observations that can be made from this graph, please read the next blog post in which I reveal my solution to the puzzle, and discuss the implications for utility financial management: https://efc.web.unc.edu/2015/03/27/solving-the-puzzle-understanding-customers-through-their-water-use-history/