


The Upside: The water business sells one of the most important, if not the most important, products on earth. It is a product that can be used for thousands of purposes and one that has limited competitive pressures compared to other products (an overseas producer probably won’t take your market share anytime soon).
The Downside: Technology is working against it – innovation and behavior change are constantly putting downward pressure on sales. While water is an essential product, the business is not immune to the impacts of economic conditions – low growth and industrial decline can have a major impact on the bottom line. Regulation and less available supply in many states have forced providers to launch campaigns to sell less of their product. Market entry for new providers, particularly profit seeking companies, can be quite difficult and is often met with public scrutiny.
The Business: In some ways, providing water can more closely resemble a public health service than a commercial business. However, it is a business, and it must have a healthy bottom line to maintain qualified staff and sound infrastructure to ensure the public health benefits of reliable drinking water. For these reasons, the EFC actively studies the bottom line of this essential business. The business woes of many California utilities have been highlighted in the press recently as communities have been asked to cut their sales significantly. How has the business fared over the last ten years of national economic ups and downs and drought induced sales pressures?
In order to shed some light on that question, we constructed a virtual water business using financial data from Moody’s Investor Services. Moody’s maintains a comprehensive database of financial information on utilities that rely on the capital markets to fund their infrastructure. These utilities are typically utilities in more urban settings (smaller water systems typically turn to public funding programs or regional financial institutions for their capital and are not rated). We took 9 years of Moody’s financial data and aggregated data for 294 water and water and wastewater combined utilities across the United States (accounting for 37% of the population with piped connections). We studied how the finances of this aggregate group have evolved over time across the US and regional scales. How did the business do over time? Figure 1 shows the evolution of revenue over the 9-year period from 2004 to 2012.

Figure 1. Operating revenues over time for all 294 water utilities across the US, by Census Bureau Region from 2004-2012
Collectively, these utilities generated just under $24 billion in 2013, showing a 60% growth over the 9-year period. In comparison, the newspaper publishing industry endured negative changes in annual revenues each year throughout this time period, falling in revenues by 35% over the same 9-year time period. Compared to other industries, the revenue growth of the water utility business may seem impressive. However, this growth has been inconsistent across individual utilities and time periods.
From 2005 to 2006, at a national level, median changes in water utility operating revenue increased the most – by 10% (Figure 2). While median changes in operating revenue still increased during the economic recession from 2008-2009, it increased by the lowest amount – by 2.4%. From 2010 to 2011, the second highest increase in change to total operating revenue occurred at 7.25%.
Regional trends tell a slightly different story, showing negative changes in median total operating revenue for the Midwest (-1.51%) and the Northeast (-0.42%) from 2008 to 2009. While 2008-2009 was an economic downtown across the country, various factors could have influenced these negative changes in operating revenue.
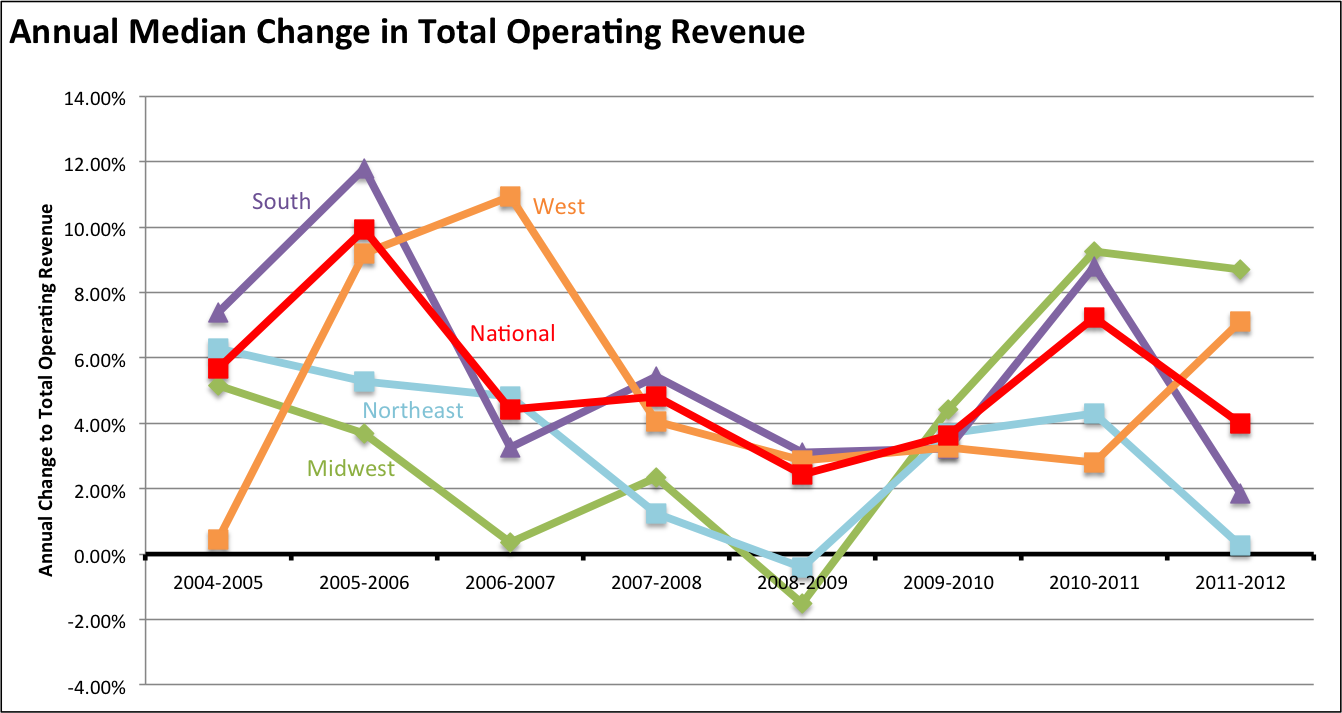
Figure 2. Annual median change in total operating revenue for 294 utilities by US Census Bureau Region from 2004-2012
Changes in total operating revenue may be influenced year to year due to changing pricing structures and rates, population, customer demand, and weather patterns. While some of these can be controlled to varying degrees to smooth out revenue trends, it is clear that even with these controls, the changes in total operating revenue are unstable and unpredictable. Water utilities must implement tools to ensure a smoother trend in total operating revenue, or at least ensure that large decreases do not occur in the future, as it compromises both their net revenue and their credit rating.
Innovative pricing tools are being introduced at various water utilities across the country and demand patterns are being analyzed with more and more data. However, one factor that an individual utility cannot control is weather. An S&P CreditWeek Report in 2012 reads, “We have observed that one of the most common – but certainly not the only – reasons for a utility to miss its financial targets in a fiscal year is because of weather.” With climate change and increasing uncertainty in weather, tools to manage the financial risk of water utilities in times of extreme weather must be introduced. A tool to protect water utilities against the financial risks of weather is hydrologic index-based insurance. While this idea has been introduced to utilities, it has yet to be put into practice. With the implementation of these and other innovative ideas, water utilities could help protect themselves against missing financial targets and improve revenue growth.
Rachel Baum is a graduate student at UNC studying environmental financial risk management.

Interesting analysis. I’d like to better understand the universe of utilities included in your study and your methodology for aggregating data. Is a more detailed report on this work available?
Hi Peter — The EFC and WRF worked on a the project, “Defining A Resilient Business Model for Water Utilities” that details more of the revenue (and expense) analysis. The report information can be found here: http://www.efc.sog.unc.edu/project/defining-resilient-business-model-water-utilities. Additionally, my work with Dr. Greg Characklis explores more intricate methods for revenue analysis – would be happy to discuss if you’d like.