Tag: revenue (Page 1 of 2)

Using the Revenueshed Model to Investigate Watershed Funding

What is a revenueshed?

A revenueshed is the geographic area within which revenue is generated for a defined purpose. It’s a play on words of watershed, an area that drains all water to a common outlet. The purpose of the revenueshed is to model methods of revenue generation for a designated funding goal using new and existing mechanisms. The revenueshed also expands those who pay beyond the traditional polluter pays model by incorporating additional beneficiaries into the model. For example, rather than using solely the boundary of a watershed to source funding for a water quality project, a wider boundary could be drawn to include local governments holding drinking water allocations for the specified water body[1].

Continue reading

How are North Carolina Utilities Faring During the Pandemic? Four Key Insights from Survey Results

With the ongoing COVID-19 pandemic, utilities across the nation continue to adapt to rapidly changing conditions through a number of measures, from suspending water shut-offs to implementing cost-saving maneuvers like reducing energy costs.

To better understand some of the financial implications of the pandemic, the Environmental Finance Center surveyed 93 water and wastewater utilities in North Carolina in early May on a range of topics, including payment plans for delinquent customers, how long they can pay all operating and capital expenses, changes in total revenue collected, staffing for utility operations, plans for the next fiscal year’s rates, and the scope, funding, or timing of capital infrastructure projects for the year.

Four key insights from the survey are detailed below. Each finding is coupled with graphs showing the response distribution for the survey question connected to the key finding. Continue reading

Watts Up With Cost Recovery for Municipal Residential Electric Utilities in North Carolina?

How financially healthy are the municipal residential electric utilities in North Carolina? That is a broad question, and one of keen interest to many customers of those utilities. This is especially true at a time when Duke Energy Progress and the North Carolina Eastern Municipal Power Agency (NCEMPA) are discussing the possibility of Duke Energy Progress purchasing NCEMPA’s electric generating assets, and where rate payers may be wondering what such a sale could mean for their future electric rates, as discussed in this previous blog post on affordability of residential electricity in N.C. Continue reading

$napshot: Debt Service as Percent of Total Operating Revenues


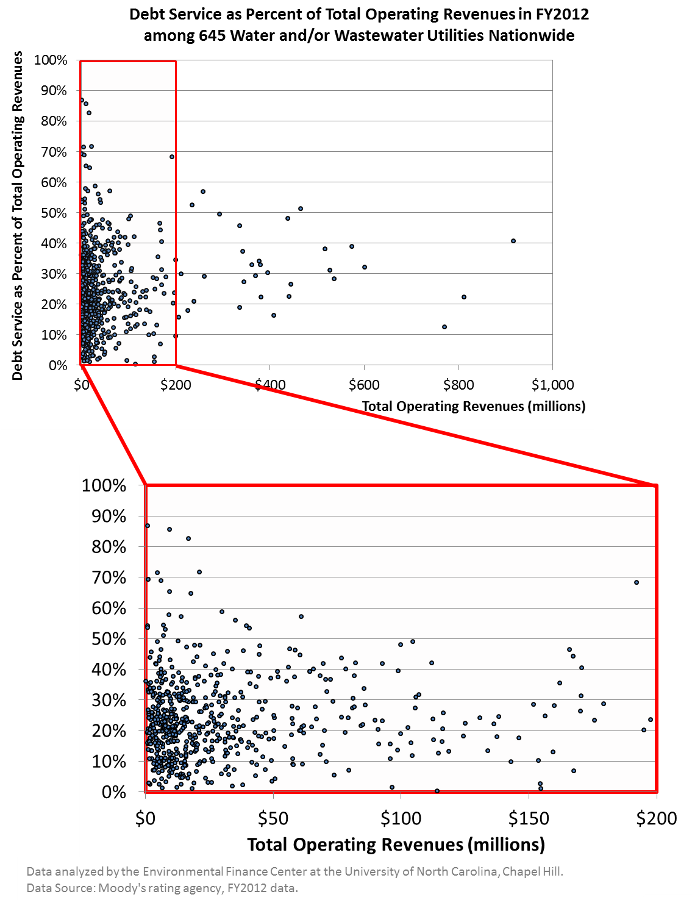
Debt Service as Percent of Total Operating Revenues in FY2012

Last Thursday, while we were presenting one of two Water Research Foundation webinars (view recordings of the webcasts for free) on the financial strategies that water utilities have or can employ to improve revenue resiliency against changing financial trends, a participant on the webinar asked if we have any benchmarks on debt service as a percent of operating revenues. The graph above shows how debt service in FY2012 compared to the total operating revenues of 645 debt-paying water/wastewater utilities across the U.S. from Moody’s rating agency. 58% of the debt-paying utilities spent between 10% and 30% of their total operating revenues on debt service in FY2012. Only 11% of the utilities spent more than 40% of their revenues on debt service in that year. There does not seem to be a major distinction between small and large utilities in terms of the proportion of revenue spent on debt service. In our recently published WRF report, Defining A Resilient Business Model for Water Utilities, we showed that this proportion of debt service to operating revenues remained relatively steady between FY2003 and FY2012, despite declining water use. Spending a quarter of annual operating revenues on debt service requires careful financial planning on behalf of the utility since debt service is a fixed cost that must be paid regardless of fluctuating water sales and revenues. These findings are part of the research for Water Research Foundation project #4366.

A $napshot is a graphic revealing an interesting environmental finance finding accompanied by a short post. This $napshot was created by Shadi Eskaf.

$napshot: Utility Rate Increases versus Revenue Increases

A $napshot is a graphic revealing an interesting environmental finance finding accompanied by a short post. This $napshot was created by Shadi Eskaf.

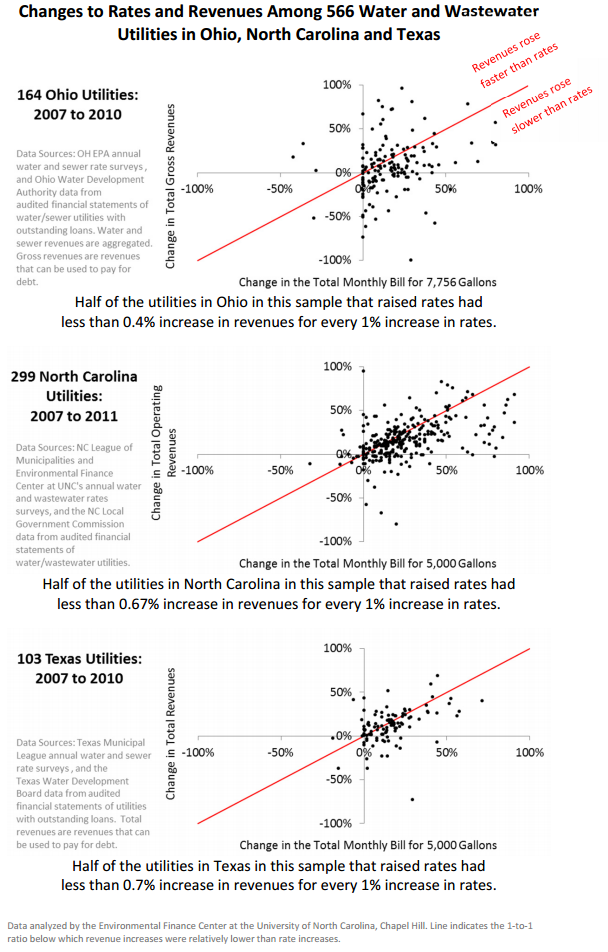
Changes to Rates and Revenues among 566 Utilities

Changes to Rates and Revenues among 566 Utilities

While revenues usually rise as water and wastewater rates increase, revenues generally rise slower than rates. The graphs show how 566 utilities in three states changed rates over a three or four year period, and the subsequent change to annual revenues in the same time period. Four observations can be made. Continue reading

« Older posts