

Stacey Isaac Berahzer is a Senior Project Director for the Environmental Finance Center at the University of North Carolina, and works from a satellite office in Georgia.

In teaching environmental finance we develop many charts and graphics to help illustrate the concepts that we are trying to get across to our audiences. But, it is more heartwarming (and less work!) when a utility itself uses its own data to create a chart that illustrates one of these key concepts so well. The example above is probably one of the graphics most-used by UNC EFC staff, but it was developed by staff at the Charlotte-Mecklenburg Utility (CMU) a few years ago. In fact, the chart above was featured in one of the first blog posts by our partners at Raftelis Financial Consultants.
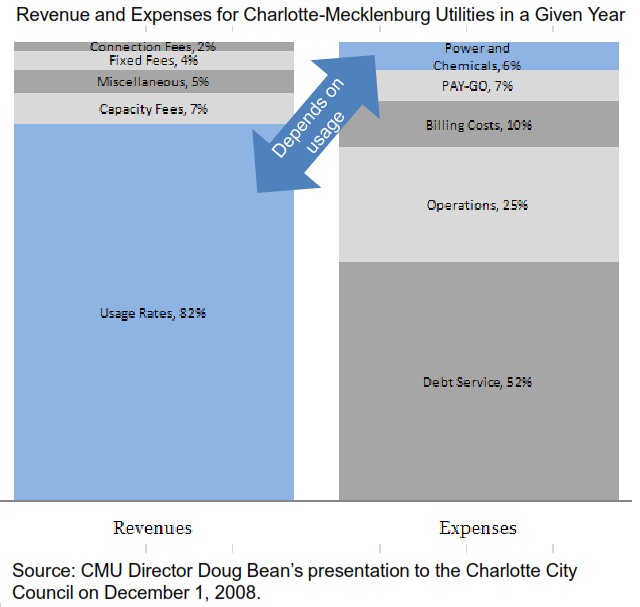
Finance folks love this chart because it so eloquently depicts one of the major challenges with managing a water/sewer utility, that such a large portion of the costs involved are fixed. The blue areas of the graphic indicate areas that depend on usage. Let’s focus on the left bar that deals with “expenses.” It shows that only 6% of annual expenses at the utility are related to the AMOUNT of water sold. The other 84% of expenses are incurred by the utility, even if, in essence, no water is sold. (The problem is compounded by the fact that the “revenues” bar is the inverse, where most of the revenues come from the unpredictable area of “usage rates.”)
Why Energy?
If we focus on this small variable portion of a utility’s expenses though (the 6% in the case of CMU in 2008) we find that energy is the area that merits most attention. Energy is usually the largest single controllable cost at a water or wastewater utility. Perhaps more noteworthy though is that energy is a relatively rapidly increasing cost. Most water and sewer facilities came online when energy costs were so low that energy efficiency was not a primary objective of the design process. With the rising costs of energy, and the air quality issues associated with energy production, energy management has floated to the top of priorities in the water industry.
Why Now?
With the rising cost of energy, utilities are becoming more interested in new ways to manage their energy bill. The 2009 American Recovery and Reinvestment Act (ARRA) also helped to generate some more “novel” energy projects at water/sewer utilities. One example is Gwinnett County, Georgia’s gas-to-energy facility at the F. Wayne Hill Water Resources plant. Known as “POWER” (Processing Organic Waste for Energy Recovery), the facility produces 40% of the plant’s energy needs, as well as all the heat needed to operate the plant’s anaerobic digesters. Projects like this one, funded through ARRA, are up and running now, providing tangible evidence of their financial and environmental benefits, enticing peer utilities to embark on similar efforts.
One of the efforts to raise awareness and promote energy management at water utilities is the Energy Management Initiative for Water & Wastewater Utilities in Tennessee. During the spring of 2011, the U.S. Environmental Protection Agency (EPA) and the Tennessee Department of Environment & Conservation (TDEC) assembled a team to conduct an Energy Management Initiative (EMI) for Tennessee Water and Wastewater Treatment Systems.
")
The team consisted of EPA Region 4, TDEC, the TN Department of Economic and Community Development, the Tennessee Valley Authority, University of Memphis – Civil Engineering Department, University of Tennessee – Municipal Technical Advisory Service, University of North Carolina – Environmental Finance Center, and Schneider Electric. The EMI process involved an initial energy assessment and benchmarking stage, followed by a series of four workshops that were based on the ‘Plan-Do-Check-Act’ (PDCA) management framework. PDCA is designed to help water/wastewater utilities better understand their energy consumption, identify opportunities for improvement, prioritize projects for potential funding, measure success, reduce or avoid energy costs, and reduce greenhouse gas emissions. The following are the seven (7) communities that participated:

Potential energy savings results for Caryville-Jacksboro utilities from the Tennessee partnership.
- Caryville-Jacksboro Utilities Commission
- City of Columbia
- Fayetteville Public Utilities
- City of Franklin
- First Utility District of Knox County
- Lenoir City Utilities Board
- Nashville Metro Water Services
The combined potential savings for all seven facilities is listed on the Tennessee Dept. of Environment & Conservation website as: “7 million kilowatt hours per year, which would reduce CO2 emissions by 6,696 tons, equivalent to 1,190 cars removed from the road for a year or 739 homes powered for a year. Projected annual savings ranged at each utility varied from $15,750 to $210,000.”
Now that’s a broad range of savings… Where would your utility fall?

The press release event for the TN energy partnership was very well done and well attended in a beautiful location, the Bicentennial Mall in Nashville. The carillon played Tennessee Waltz as the event began. A piece about the event was shown on at least one local newscast.