

Guest Author Rocky Craley is a Senior Consultant at Raftelis Financial Consultants.

Breaking News: Utility rates have continued to increase over the last two years, according to the 2012 Water and Wastewater Rate Survey. That’s the highest-level survey summary, which is (admittedly) not very groundbreaking. But digging into the national rate survey provides a little more information than that – actually, quite a bit more. Surveys such as this provide insights into the water and wastewater industry that enable utility executives, staff and other industry professionals to benchmark rates and key utility metrics against peer utilities. Utilities also use survey data as supplemental information to convey the state of the industry and effectively educate decision makers.
The Water and Wastewater Rate Survey is a biennial survey that has been conducted by RFC since 1996. Coproduced by AWWA and RFC, the survey integrates rate, rate structure, demographic, financial, and other utility information into one survey effort. This edition will be published in January 2013 and includes responses from 313 utilities in 44 states and the District of Columbia.
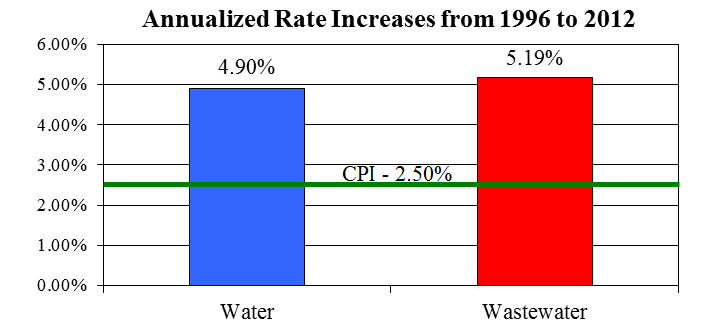
From a utility perspective, the most anticipated data relates to rates and how rates compare to those of peer utilities. Determined through comparative analysis of data from utilities that have participated in both the 2010 and 2012 surveys, a residential customer who consumes 10 CCF (7,480 gallons) per month has seen their average monthly water and wastewater bills increase by 13.7% and 15.0%, respectively. Median monthly bill analysis shows that customers pay a monthly water bill of $29.82 and wastewater bill of $37.59 for 10 CCF. Since 1996, water rates have increased by an average of 4.90% and wastewater rates by 5.19%, while the CPI has increased by only 2.50%.

The 2012 survey results include plenty of information in addition to water and wastewater rates. For example, financing statistics show that large utilities have seen an approximately $20 million increase in average annual wastewater capital needs. Small, medium, and large water and wastewater utilities have experienced a rise in long-term, outstanding principal debt, with large utilities experiencing the most significant increase of approximately $200 million in principal between 2010 and 2012. Consequently, water utilities, in particular, have experienced an overall decrease in the level of equity in their systems.
Selected preliminary results from the 2012 Water and Wastewater Rate Survey have been shared above, and these are subject to minor changes as analysis progresses. The challenge with any set of survey results is digging in and finding meaningful metrics that are useful to a utility’s personnel, stakeholders, and decision-making process. AWWA and RFC are very excited to release the results of the 2012 edition and share with participants the depth and breadth of information contained within.

So I understand the survey includes demographic in their analysis, but what is the culprit here? Does the change in weather patterns have anything to do with this (i.e. drought areas)?