Matt Harris is the Marketing and Outreach Coordinator for the Environmental Finance Center.
The etymology of the word “dashboard” is an interesting story of technological change and innovation over time. Originally the name given to the plank(s) of wood or leather in front of a horse-drawn carriage to keep out mud “dashed” from the movement of the carriage, over the course of history the word “dashboard” and the actual technology associated with this part of the vehicle, has advanced significantly. With the automobile humans added complex navigational and control instrumentation to the mud-blocking area to continue protecting the driver from the myriad of problems created by moving at unnatural speeds. It is no surprise that the business and financial communities have adopted the metaphorical language of the dashboard technology.
Fundamentally the purpose of any “dashboard” whether on a car, carriage, or computer remains the same: to “keep out the mud”. Or rather to resolve problems in real time while driving through the world at a fast (some might say unnaturally fast) pace.
At the Environmental Finance Center at UNC-Chapel Hill our rates dashboards are no different—created to guide the drivers of rates. In a complex economy, prices need to be set efficiently and realistically or they don’t reflect the reality of the world in which people live. If rates are set too high in a community where wages are low, the issue of affordability is magnified. If rates are too low but water is scarce, a realistic need to conserve is going un-signaled to consumers that derive information on water scarcity from its price. Finally, and perhaps most importantly to the drivers of rates, if the price of water is too low the cost of driving the utility could go unrecovered—that is you could run out of gas.
But water utilities don’t control the wages in the community, the weather, the charges of other utilities; and they have limited control over most of their operational costs (which tend to be fixed due to necessary water infrastructure). Setting rates becomes one of the primary levers for utility financial sustainability. This is why we update our dashboards every year with the most up-to-date data available from the US Census Bureau, local government financial statements, and EFC rates survey data. (You may have received a phone call from one of our friendly student research assistants!)
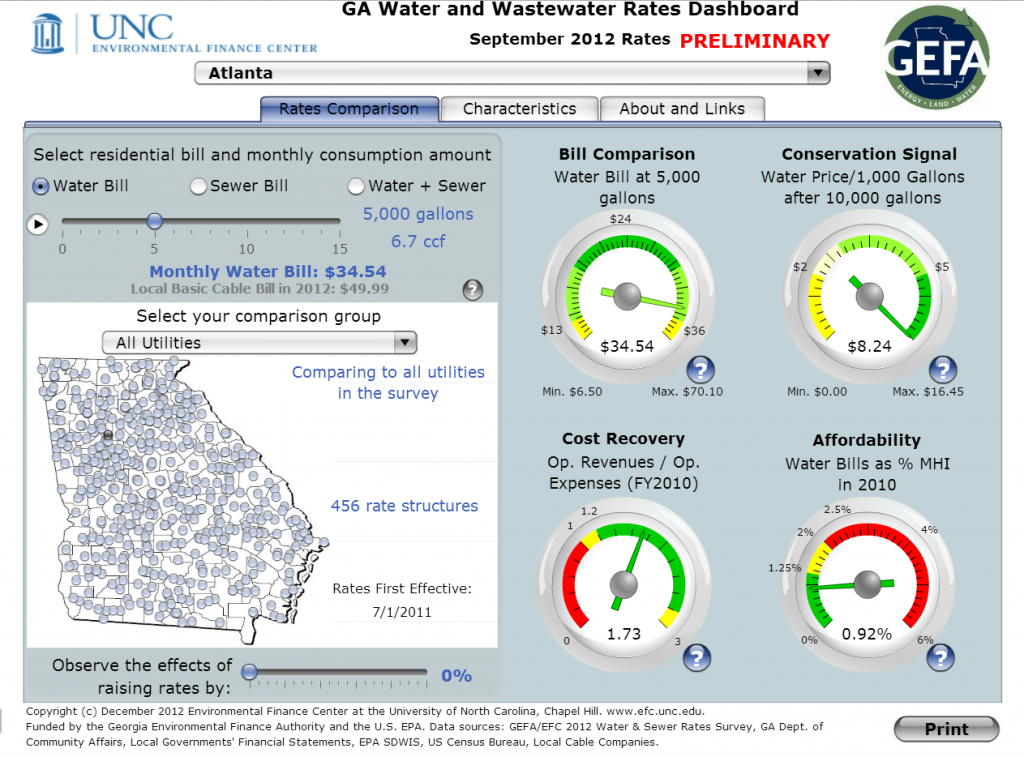
This December we’ve released the 2012 Georgia Rates Dashboard in partnership with the Georgia Environmental Finance Authority to give Georgia water utilities the chance to tune-up their rates next fiscal year.
It is never wise to compare utilities 1 to 1, so the Georgia Rates Dashboard (and all of our dashboards) compare utilities in selectable peer groups based on the following criteria:
Similar Number of Accounts
Similar Revenue Generation
Same River Basin
Same Water Source
Similar Customer Income
Same Water Regional Planning
Within 50 Miles Distance
(You can also of course compare all utilities across the state of Georgia.)
The amount of residential water used per month also functions as a sliding scale on the dashboard so that you can choose the average monthly consumption for your utility, or look at peak usage levels.
You can find all of our rates dashboards for Georgia, and other Southeastern states on our website here:
http://efc.unc.edu/RatesDashboards/index.html
On this page you will also find useful tutorials for using the dashboards and additional resources on how to drive your rates car, you can even check out the owner’s manual. So buckle up and keep your head out of the mud!
FOR GA UTILITIES:
On this webpage (http://efc.unc.edu/ga/rates.html#ratesheets), you will find the new “rate sheets” and dashboard for 2012. If you are a Georgia utility, please review your community’s information (or pass along to communities you work with) and respond to Stacey Isaac Berahzer if your data is incorrect. We will need such edits by December 31st, and would really appreciate your feedback so that our final dashboard can be as accurate as possible. Thank you!


0 Comments
1 Pingback