

Sarah Royster is a graduate student with the UNC School of Public Health pursuing a Master’s Degree in Environmental Engineering. She works as a Research Assistant with the Environmental Finance Center.
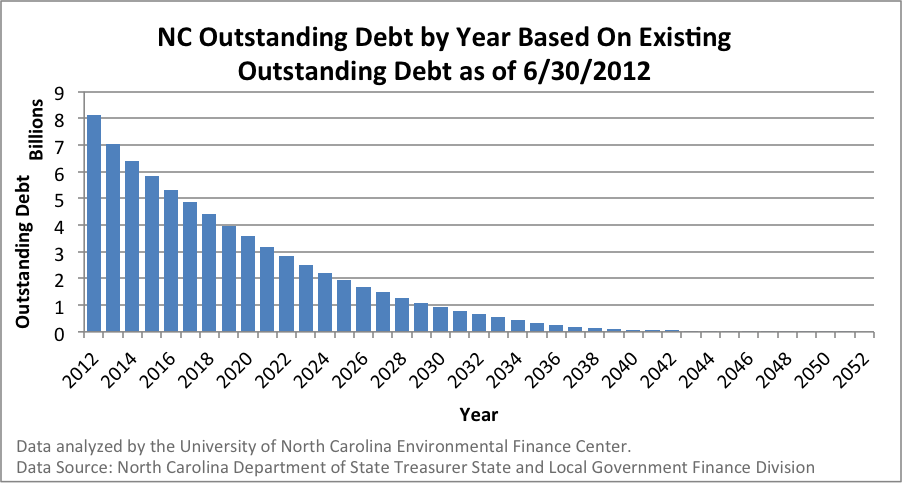
Debt and debt management for water and sewer utilities are becoming increasingly important as our country’s infrastructure needs continue to grow. The U.S. Environmental Protection Agency’s recently released 2011 Drinking Water Infrastructure Needs Survey and Assessment indicates that $384.2 billion in water infrastructure investments is needed over the next 20 years. Ten billion dollars of this need comes from North Carolina and much (if not most) of the infrastructure will be funded through debt. This makes North Carolina one of only ten states in the country with an infrastructure need above ten billion dollars. Many are concerned that financing such a large amount of debt will be challenging. Add to this concern, that North Carolina utilities already have $8 billion in outstanding debt – a value that has been consistently rising each year. In 2008, for example, North Carolina utilities had $6.7 billion in outstanding debt. This has risen to $8.1 billion in the span of four years. Paying off this outstanding debt, however, may not take as significant a toll on utility financial health as some fear. The graph below shows the outstanding water and wastewater debt for North Carolina as of June 30, 2012 and how this debt would be paid off based on linear payments to maturity date. If no more debt were issued, the current outstanding debt would be paid off by 2052. Most of this debt, however, would be paid off much sooner with a 50% reduction in outstanding debt by 2019.
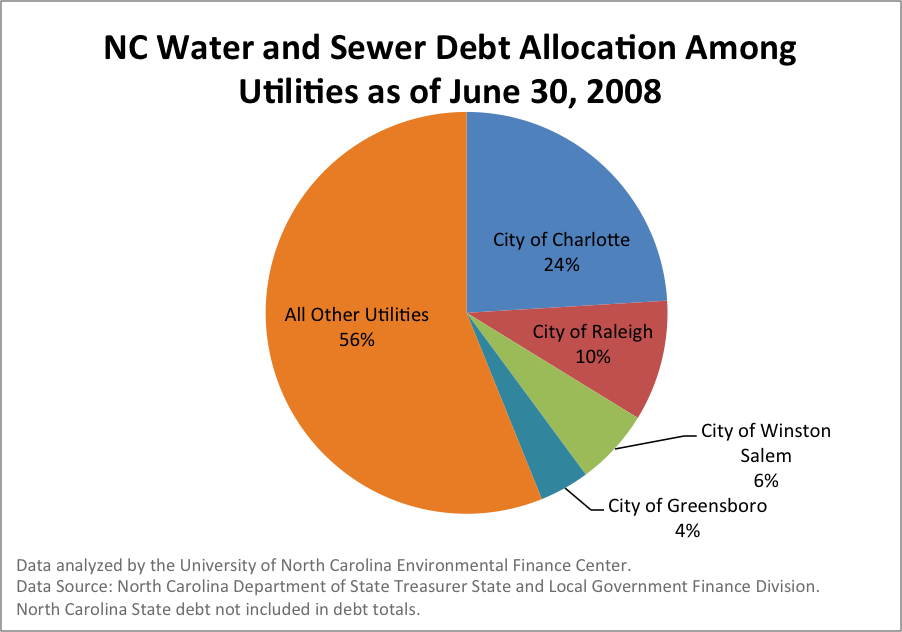
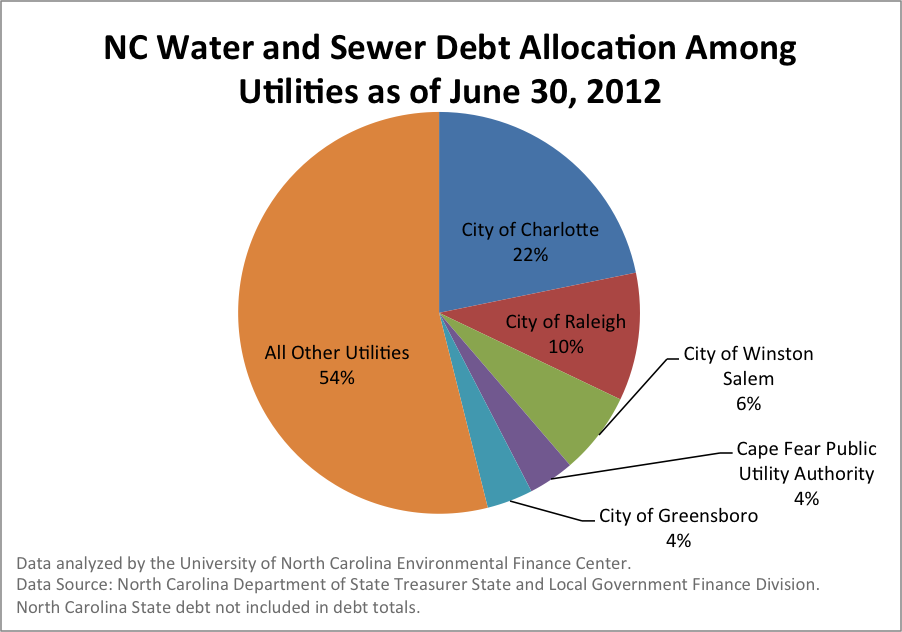
Additionally, the majority of this debt typically falls on a small number of utilities. The graphs below show a comparison of the utilities with outstanding debt greater than 4% of the outstanding debt for utilities in the entire state in 2008 and 2012 (that is outstanding debt greater than $270 million and $304 million, respectively). In both years, the City of Charlotte carried just under a quarter of the water and wastewater debt for the whole state ($1.62 and $1.65 billion respectively), followed by the City of Raleigh at ten percent and Winston-Salem at 6%.
Although these utilities carry a significant portion of the state’s total debt, this debt is typically spread out over a larger customer base, with the largest utilities typically taking on the most debt. Charlotte-Mecklenburg Utilities, for example, have the largest service population in North Carolina, with 245,854 service connections in 2012 according to SDWIS. Their long-term debt per account, however, is far from being the highest in the state despite the fact that they carry nearly 25% of the state’s debt. The graph below shows the long-term debt per account in 2012 versus the water bill at 5,000 gallons of consumption for 308 utilities in North Carolina.
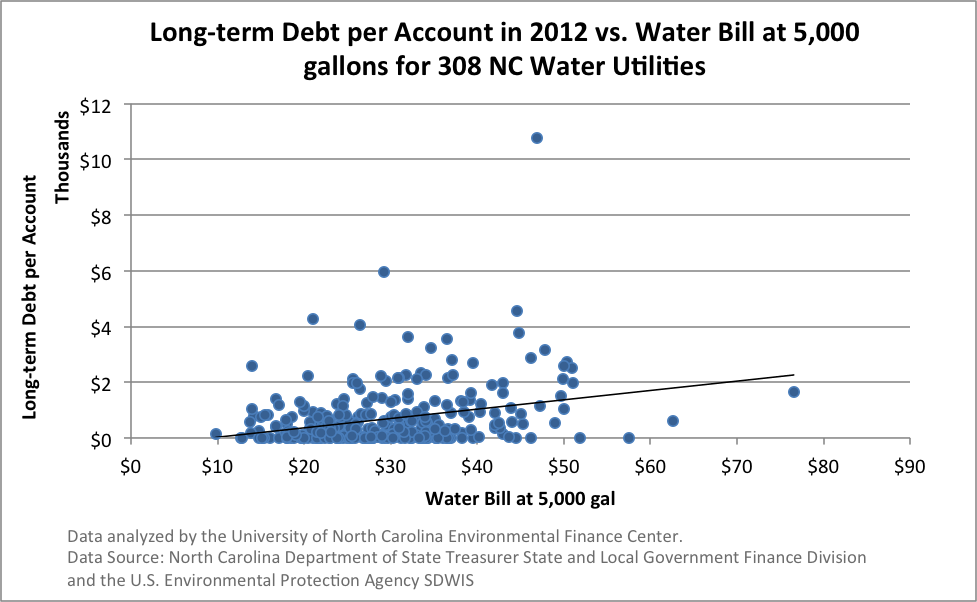
Ultimately, utilities are concerned with how financing this significant infrastructure need will impact their customers. While the utilities with the largest outstanding debt are generally not those with the highest long-term debt per account, there is a slight correlation between the debt per account, and the water bill at 5,000 gallons consumption. The state’s infrastructure needs over the next twenty years will not come without a price tag, and these expenses will likely be financed through debt and passed along to customers. Future blog posts will continue to discuss the issue of utility debt and infrastructure financing needs.

It is easy to calculate paying off debt with no additional debts. Is this ever used in real live to determine future debt? The fact remains that additional infrastructure will be needed and with the increase in filtration cost due to increase pollution of our water sources will require a never ending debt.
Not really sure where you are going with this calculation???
Bottom line is we are undercharging for water and the water is getting more difficult to provide. We need to capitalize on all water sources to reduce these debts.
Jim Harrington
Thanks for you comment Jim. I made the graph you are referring to in order to illustrate the point that North Carolina’s current outstanding debt will be significantly reduced in a relatively short amount of time as bonds reach their maturity date. Of course, in real life utilities would acquire more debt to fund much needed infrastructure upgrades. The graph merely hints that paying off NC’s current debt is feasible despite the state’s need to fund $10 billion worth of infrastructure over the next twenty years.
Sarah – Interesting piece. You might want to explore the concept of using debt to manage “intergenerational equity”. In brief, by spreading the cost of large scale infrastructure over multiple years, up to the useful life of the asset, you tie the repayment to the use (and users) of the asset.
What your outstanding debt graph demonstrates is that North Carolina has ample Debt Capacity to finance future infrastructure spending.
Thanks Tom! I do think that intergenerational equity is an interesting concept that I will certainly look in to, and I think utilities already do this to some extent because of the nature of many of these long-term municipal bonds. Linking bond repayment to asset use however, could be useful in reducing annual debt repayment and spreading out the debt burden more equitably.