

Chris Kenrick is a Research Assistant at the Environmental Finance Center and is pursuing dual master’s degrees in information science and public administration.
Have you ever spent hours upon end gathering information from government websites? Some websites have the information you are looking for right on the home page, and then there are others that you can spend half a day on without success. Now, have you ever had the privilege of searching a local government website for an easy explanation of their water and wastewater rates? Well if you have, we feel your pain, but we are about to become your new best friend.
Dashboards: They’re Not Just for TV Stars!
As mankind started to move forward into the “Information Age,” the average person could not comprehend what the future held in store for the sharing and distribution of information. While the Internet has done wonders for expanding knowledge on all fronts, it also created a sort of shift from a lack of information access to an information overload. It is with this overload in mind that the staff of the Environmental Finance Center at UNC-Chapel Hill decided to create interactive dashboards that make water and wastewater utility rates not only easier to understand, but also useful for policy makers.
 Now, before you start thinking that using our dashboards will make you as cool as Michael Knight (or David Hasselhoff for those non Knight Rider fans), I have some bad news: our rates dashboards are just a tad bit different from Knight Rider’s talking dash – but certainly no less useful. For a more in-depth discussion on the history of dashboards, give the blog post, “Driving Rates: Get a 2012 Georgia Rates Dashboard Tune-Up” the read it deserves.
In 2012, the Colorado Municipal League and Special District Association of Colorado collaborated with the Colorado Water Resources and Power Development Authority, to conduct the 2012 edition of the Water and Wastewater Utility Charges and Practices in Colorado. Using the results of this survey, the Environmental Finance Center at UNC-Chapel Hill created the 2012 Colorado Water and Wastewater Rates Dashboard, This dashboard displays the rates of 112 water and/or wastewater utilities in Colorado, among many other benchmarking and analytical measures. For more information on the development and features of the Colorado dashboard, read David Tucker’s post: Water and the Land of the Color Red: The 2012 Colorado Water and Wastewater Rates Dashboard.
The Ever-Changing Relationship between Water Rates and the Continental Divide
While all of our dashboards are unique in their own way, one of the cool features in the Colorado dashboard is the comparison of utilities on the same side of the Continental Divide. Colorado is a unique state when it comes to water resources. Almost 70% of the state’s natural precipitation falls on land West of the Continental Divide, yet somewhere near 90% of Colorado’s population lives East of the Continental Divide.
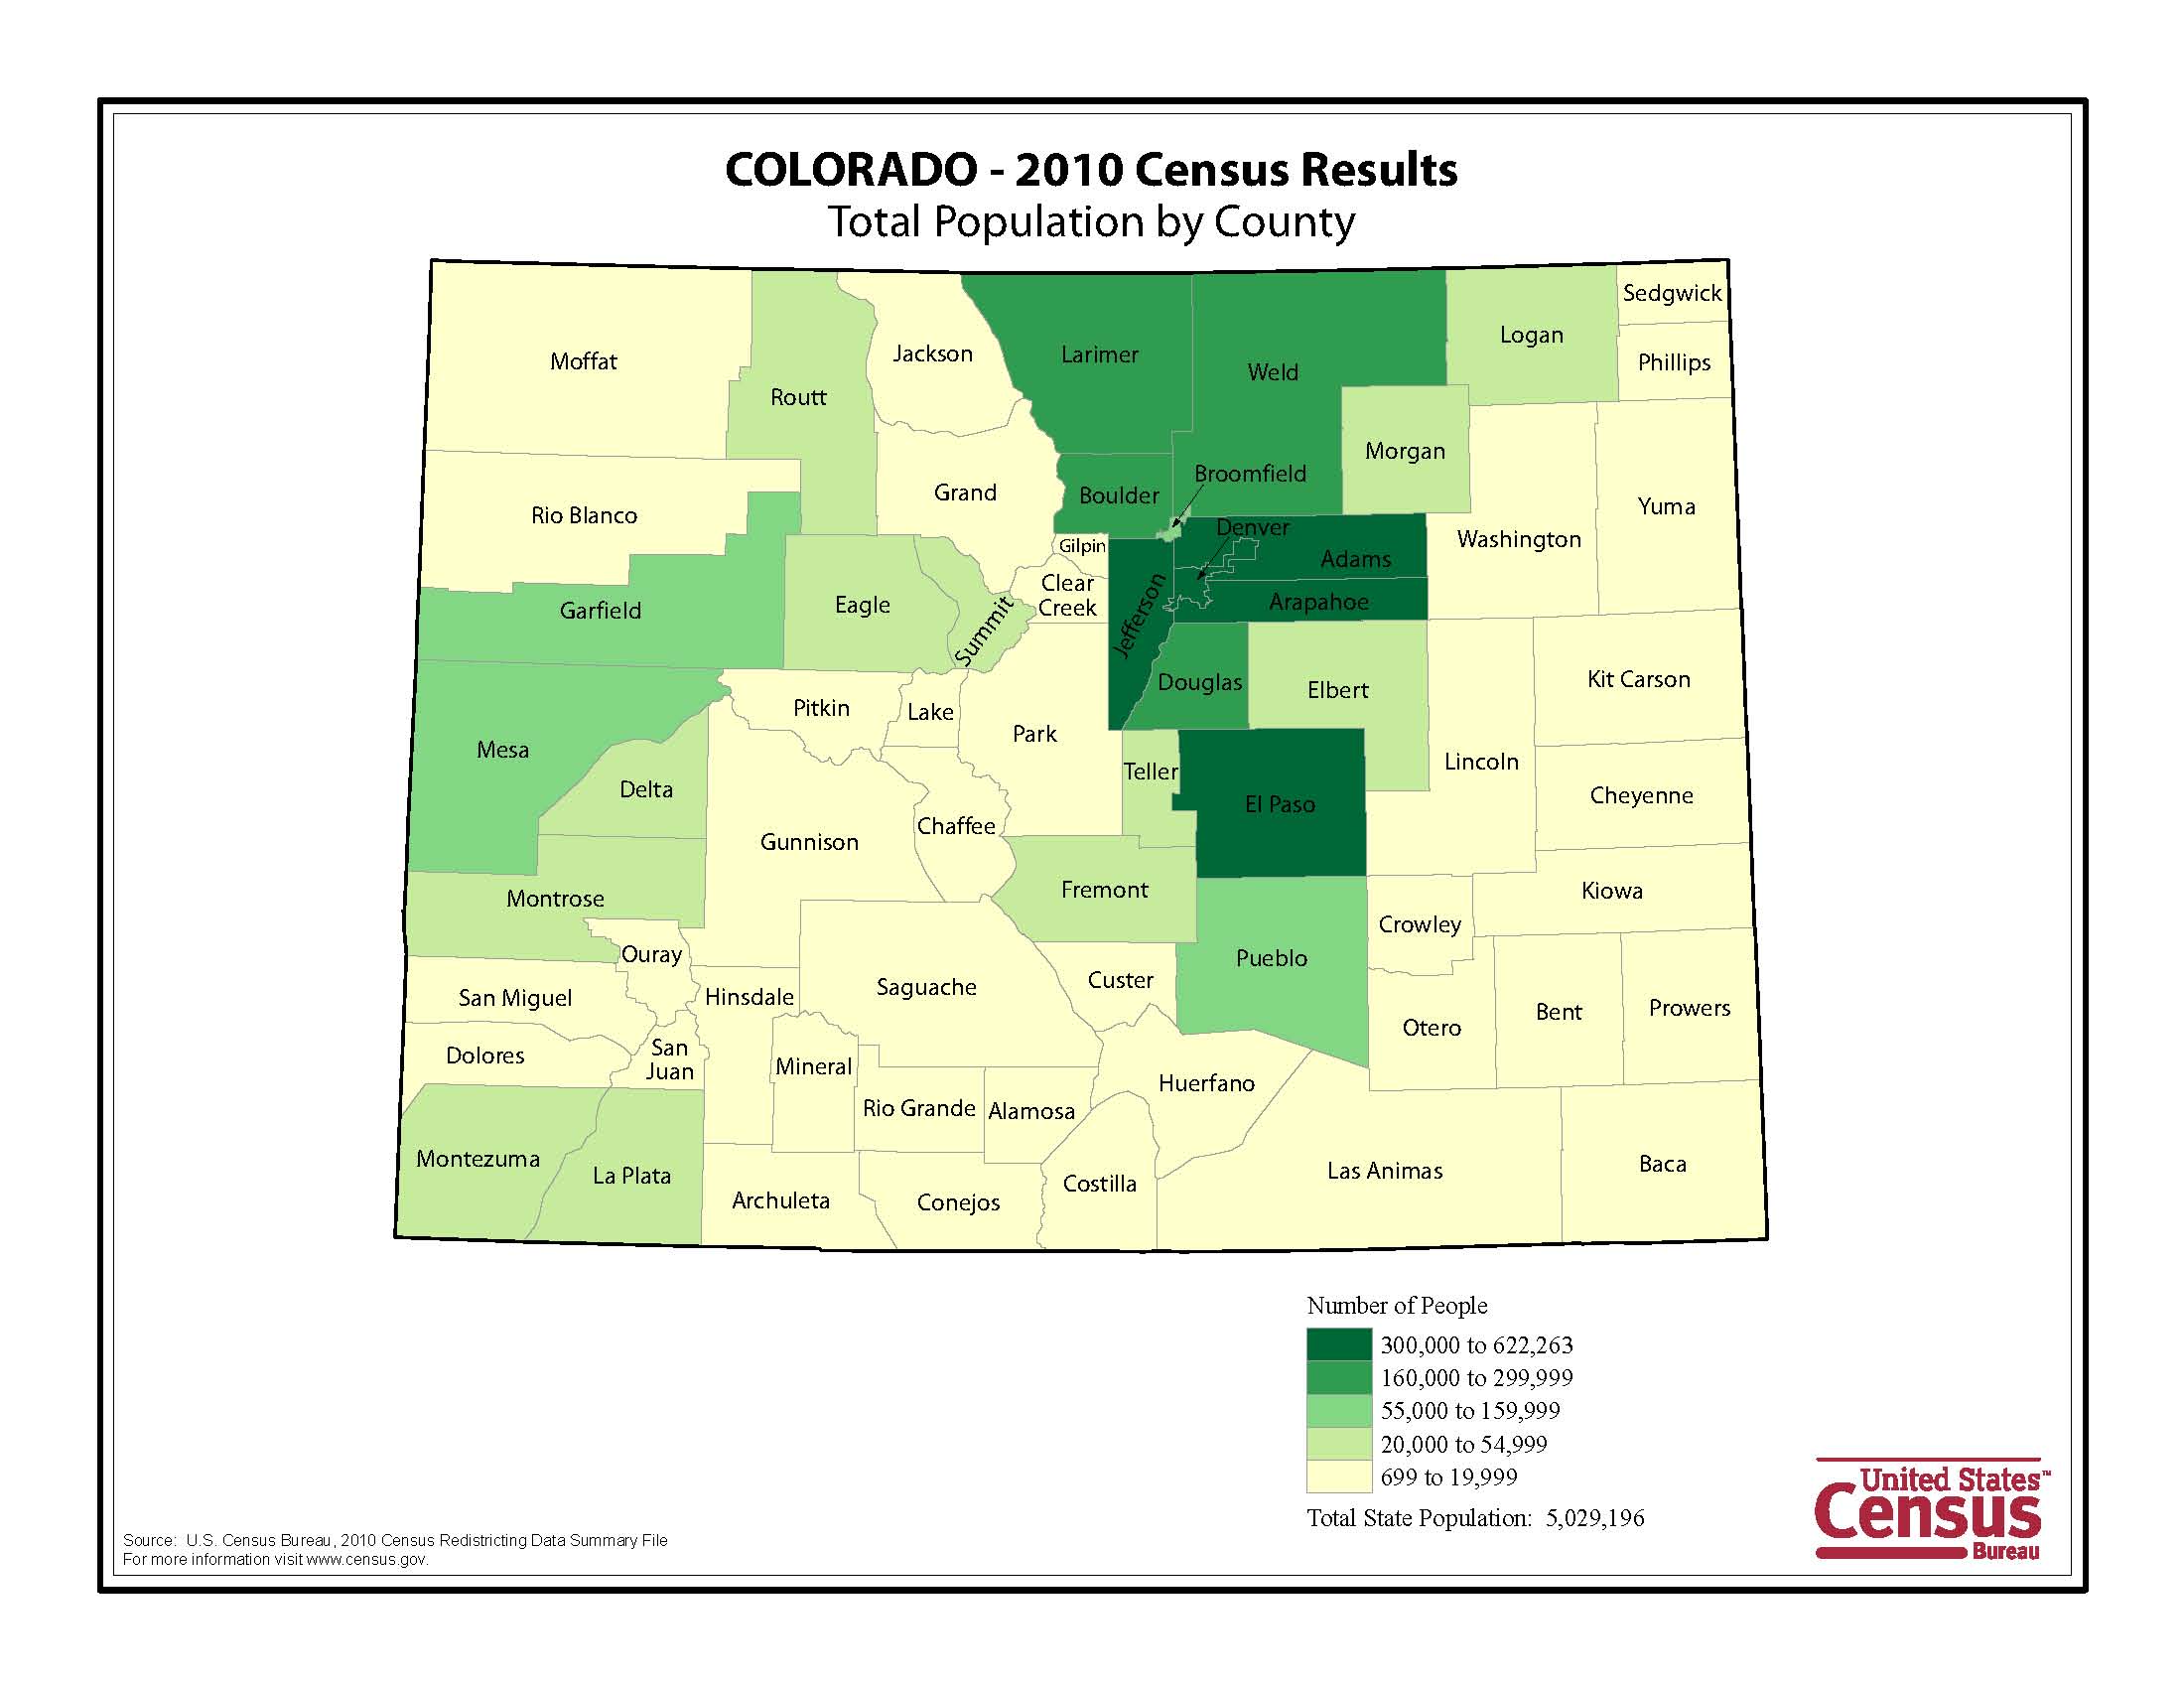
In order to gain access to the much-needed water, many utilities located on the east must divert water from areas such as the Colorado River Basin located on the Western Slope. This becomes extremely important during times of major droughts, including the ongoing 11-year historical drought currently occurring in the state. According to the U.S. Drought Monitor, approximately 83% of the state of Colorado is experiencing a severe drought.
While this year’s Colorado Water and Wastewater Survey did not show any significant differences in the average rates for those utilities on the Eastern Slope of the Continental Divide and those on the Western Slope, the unpredictable nature of the changing climate may affect future rates. This is especially true for states like Colorado where many utilities do not have immediate access to a water source, while those utilities that do are unsure of their water source’s future. The U.S. Department of the Interior – Bureau of Reclamation provides an example of this scenario in a three-year study discussing the future of the Colorado River Basin as it supplies water to the rapidly increasing population in the time of an ongoing statewide drought.
While it is difficult to predict what future access to drinking water might look like, access to a little more information can’t hurt, right? So why not take a few minutes to look at our dashboard and judge for yourself.

Leave a Reply