One hazard that water utilities with financial difficulties face is an increased risk of falling out of compliance of federal requirements and drinking water regulations. Violating regulations often triggers enforcement actions (and sometimes fines) by the state primacy agency, adding to the time and expense of running the water system. This can be extra troublesome if those utilities are already financially constrained. We analyzed national and regional data and found that unfortunately, there is statistical evidence that correlates small water systems’ financial difficulties and some types of violations.
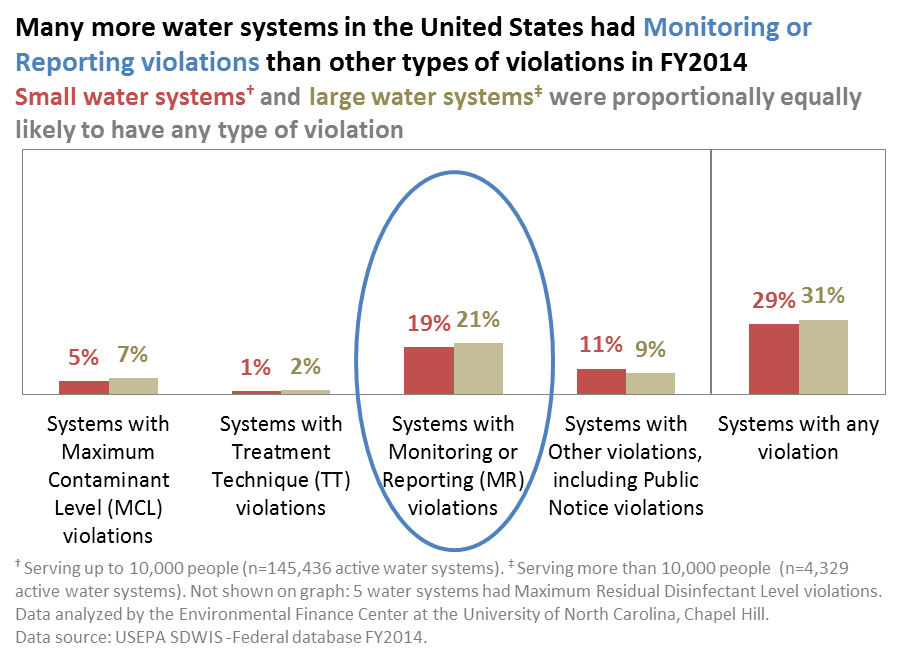
We analyzed water systems’ violations data using the U.S. Environmental Protection Agency’s (EPA) federal Safe Drinking Water Information System (SDWIS). This database contains records of significant violations of all water systems in the United States. In FY2014, there were 149,765 active water systems in the U.S., and 42,865 (29%) had at least one violation during that year.
Observation #1: Water systems across the board have more violations of management-related standards than health-based standards
SDWIS lists violations in five broad categories, described in detail in the annual “Providing Safe Drinking Water in America: National Public Water Systems Reports”:
- Maximum Contaminant Level (MCL) violations
- Maximum Residual Disinfectant Level (MRDL) violations
- Treatment Technique (TT) violations
- Monitoring or Reporting (MR) violations
- Other violations, including violations of required communication with the state and customers such as the issuance of Consumer Confidence Reports, Public Notices, etc.
The first three of these categories (MCL, MRDL and TT) are considered health-based, because violating any of those requirements could endanger the health of the water system customers. The other two categories of violations (MR and Other) reflect failure to follow procedures and timelines in monitoring, tracking, reporting and/or communicating with other stakeholders, which are more management-related standards as opposed to health-based standards. In FY2014, 25% of water systems had a MR and/or Other violation, compared to only 7% of water systems that had a violation of health-based standards.
Interestingly, this result does not differ significantly by water system size. Large water systems are equally likely to have a violation of any kind as small water systems. Further analysis reveals that only the very large water systems, those serving 100,000 people or more, were significantly less likely to have MR or Other violations than other systems, but still were equally likely to violate health-based standards.
In addition to SDWIS violations data, the EFC at UNC collected, interpreted and compiled recent financial performance data (in FY2012 or FY2013) for utilities in four states: Alabama, Arizona, Georgia and North Carolina. Nearly all of the local government-owned water utilities in those states are included in this financial database, along with hundreds of investor-owned utilities.
Since small water systems face inherent managerial and financial capacity constraints due to their small staff size and customer base (summarized on page 5 of this EPA report), we focused our subsequent analysis on water systems that serve 10,000 people or fewer.
Observation #2: Many more small water systems have financial and managerial capacity needs than technical needs to deliver safe drinking water
Using the financial data, we calculated an operating ratio (total operating revenues/total operating expenses) for each water utility, determining whether the utility collected enough revenue in one year to cover its O&M expenses and depreciation, which is considered a surrogate for potential minimum capital costs. Utilities with fewer revenues than expenses during the year are defined in this blog post as systems with “financial difficulties.” Keep in mind that financial difficulty does not mean that the utility is necessarily cash-strapped; it means that in that fiscal year, the utility did not generate enough revenue to pay for O&M expenses and have some funds remaining to pay for potential capital projects. Used in this way, financial difficulty may be an indicator of inadequate financial planning or inability or unwillingness on the part of the staff/owner/local officials to set higher rates.
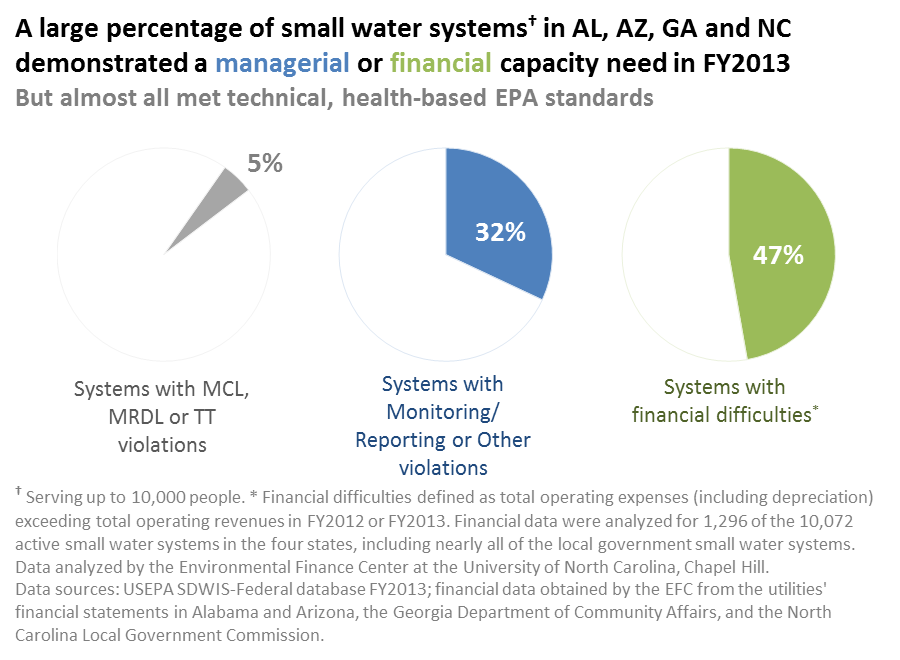
In the four states, 47% of the small water systems had financial difficulties, and nearly one-third had a MR or Other violation. By contrast, only 5% violated health-based standards. The needs of small water systems, therefore, empirically appear to be more centered on enhancing their managerial and financial capacities rather than their technical capacity to adequately treat water to drinking water quality standards.
Observation #3: Small water systems with financial difficulties were 67% more likely to have a MR violation than small water systems without financial difficulties
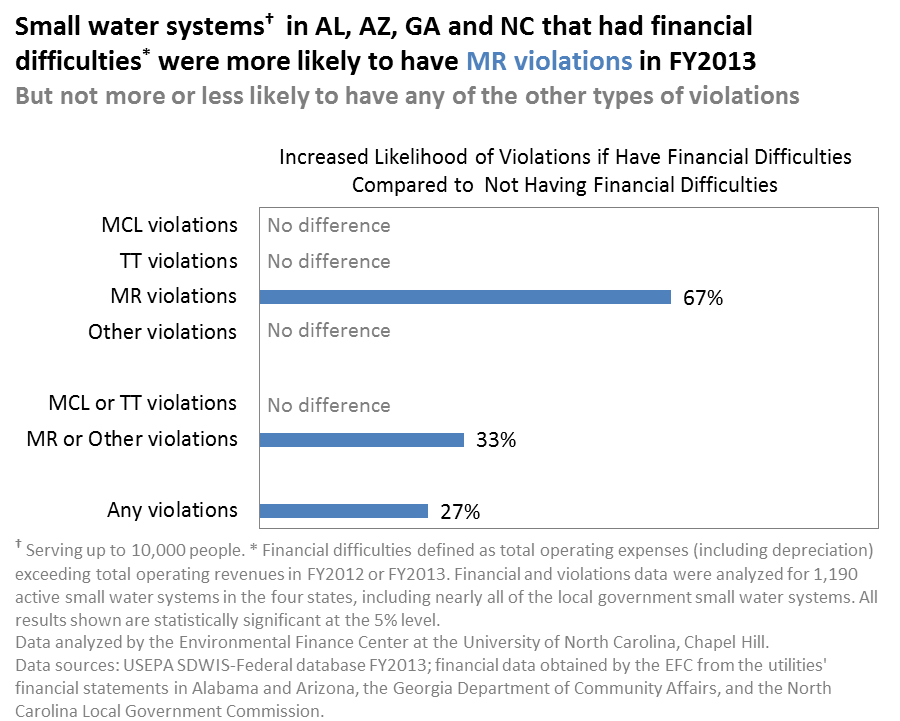
The FY2013 or FY2012 financial data of 1,190 small water systems in Alabama, Arizona, Georgia and North Carolina were matched one-to-one with their FY2013 violations data from SDWIS in order to statistically test the relationships between financial difficulties and violations records of small water systems. We found having financial difficulties is positively correlated with violating EPA standards (especially MR violations) among these small water systems. In fact, compared to systems without financial difficulties, systems with financial difficulties were 67% more likely to have MR violations, 33% more likely to have MR or Other violations, and 27% more likely to have any violations. These results are statistically significant at the 5% level. It is interesting to note that this correlation was observed only between financial difficulties and Monitoring or Reporting violations (or larger categories of violations that include MR violations). Financial difficulties were not correlated with an increase in other types of violations.
Why does this relationship exist, and what does it mean for utilities?
It is not possible to claim from this analysis alone that financial difficulties cause more MR violations, or vice versa; simply that there is a positive association between the two. Perhaps small water systems that have financial difficulties have fewer staff dedicated to operating and managing the system, and have less time to attend trainings and interact with peers to keep up with changing regulations and best management practices. This may result in monitoring and reporting falling by the wayside from time to time as well as insufficient capacity dedicated to the long-term financial planning for the water system. Lack of sufficient revenues may exacerbate this scenario by limiting the utility’s ability to hire more staff, pay for more training or contract out services. The relationship might also be the converse: small water systems with monitoring and reporting violations might be dedicating what limited time, money and resources they have in addressing their violations and returning back to compliance, which reduces their capacity for financial monitoring and planning, leading to setting rates that may not provide sufficient revenues for all expenses.
Small water systems with financial difficulties may benefit twice by taking advantage of trainings, tools, resources and direct assistance on rate setting and financial management – all being offered for free (thanks to EPA) by the Environmental Finance Center Network as part of its Smart Management for Small Water Systems project. First, these resources can help improve the financial condition of the water systems. Second, by addressing their financial needs, perhaps the systems will be less likely to violate EPA regulations by devoting more resources to that cause.
Shadi Eskaf is a Senior Project Director at the Environmental Finance Center at the University of North Carolina, Chapel Hill


Did your study consider the fact that large water systems (as defined by EPA) have a greater quantity of monitoring and reporting requirements than a “small” EPA water systems?
A utility having a greater quantity of monitoring and reporting requirements will have an increased probability of failing one of the requirements.
Another way to compare compliance with population based large and small systems is to have the number of violations per person served. If “Acme Large Water System” serves 100,000 people and had 2 violations this would be “0.00002 violations per person served”; If “Smallville Small Water System” serves 1,000 people had 2 violations then this would be “0.002 violations per person served” – “Smallville” thus has a factor of 100 times greater than “Acme” for having a violation.
Hi Mark,
Thank you for your great question and suggestion. Short answer is yes, I did take into account population size in my analyses and the results are essentially the same.
First, please keep in mind that I only analyzed the financial-vs-violations data for water systems serving up to 10,000 people only, so I did not test this relationship for larger systems similar to “Acme Large Water System.” [This particular blog post was intentionally focused on small systems that we can serve under our EPA cooperative agreement]. However, even in the 0-10,000 service population range, your suggestion of dividing number of violations by population size could yield different assessments on how well a water system is doing avoiding those violations – I agree with that. In working with the violations data from SDWIS, however, I found some unexpected obstacles and the interpretation of each “violation” as recorded in the database might not be the same as the next. I found it necessary to only analyze the data in terms of WHETHER the system had ANY violations of type X in the fiscal year, rather than the number of violations, which seems to depend on more than how many separate incidences occurred that triggered a violation. So, my analysis was limited to the percentage of water systems in each population group that violated standards, regardless of how many violations the systems had. Acme Large Water System (if its population was 10,000 instead of 100,000) and Smallville Small Water System would thus both be lumped together in the group that “had at least one monitoring or reporting violation.”
Your concern that larger systems have more risk of violating standards because there are more requirements to meet is still valid. I attempted to control for that in other analyses which I did not report in this blog post. In addition to the bi-variate analyses shown above, I also ran multivariate logistic regressions that assessed the association of financial difficulties on whether or not a system violated at least one requirement, controlling for several other variables, including service population, system ownership type, primary water source type, and total operating revenues. In this sample of 0-10,000 population-served water systems, service population was, as you suspected, strongly and positively correlated with an increased likelihood of violating MR standards at least once. However, even controlling for population in the model, systems with financial difficulties still were more likely to have at least one MR violation than systems without financial difficulties (statistically significant), so the overall result is the same as I reported above.
Interestingly, I pointed out in the blog post that very large systems (serving 100,000 people or more) were less likely to violate MR and Other standards than systems of smaller sizes. Even with more MR requirements to meet, the very large systems have much more capacity to meet those regulations and have empirically done so.
Thank you again for your excellent suggestion. I may have to revisit the violations-versus-population size question some time in the future!
Shadi