Many of you know us for our Financial Sustainability and Rates Dashboards, but you may not know that these are not just limited to water and wastewater rates: there’s also stormwater! In recent years stormwater has perhaps not received the attention it deserves. Five years ago the EFC created stormwater fee dashboards for North Carolina and Georgia, and this year we’re taking them to a whole new level. For 2017 we are unveiling new stormwater dashboards for both Georgia and (eventually) North Carolina with a host of new features. The new dashboard comes at a time when stormwater has been catapulted into the limelight as the hot topic of the moment in Georgia environmental legislation.
For those accustomed to our water and wastewater dashboards, you’ll find a familiar look with many new features specific to stormwater. For example, we’ve added comparison groups to help utility managers and local officials analyze stormwater fees against relevant groups, such as:
- Similar total area – how many square miles is the utility responsible for?
- Similar service population – how many people does the utility serve?
- Same MS4 permit – how is the utility regulated by the EPA?
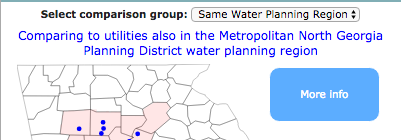
Many pertinent comparison groups like Same Utility Ownership Type, My Watershed, and Same (Georgia) Water Planning Region have been carried over from the Water & Wastewater Dashboards as well. Fourteen total comparison groups present a multi-faceted look at stormwater utilities from a range of characteristics.
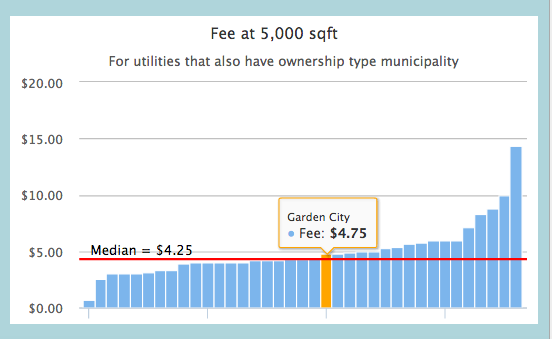
What if you want to know which other utilities are in your peer group, and where exactly your utility stands among them? We’ve updated a bar chart from our 2012 Dashboard with names that display as you hover over the bars. Explore how the lineup changes with your selected utility, comparison group, and area of impervious surface.

The new Stormwater Fees Dashboard provides more detailed information on utilities and fee structures than ever before. If you want to learn more about a utility or fee structure, you can click the blue “More Info” button to see whether the utility has an asset management or credit program, how the fee is structured, the utility’s collection rate, the Equivalent Residential Unit (ERU) size in square feet, and other supplementary information.
In addition to residential stormwater fees, the new Georgia Stormwater Fees Dashboard allows you to compare nonresidential and multi-family fees for the first time. Use the tabs in the upper left of the Dashboard to switch between customer classes.
Looking for more financial or socioeconomic data? Click the Characteristics tab within any of the customer class tabs to view the numbers. From here you can also select and change comparison groups, providing updated medians based on your selected comparison group.

Why Dashboards?
The purpose of this Stormwater Fees Dashboard is to assist local governments in developing and managing stormwater utilities across Georgia. The EFC started creating Dashboards more than 10 years ago, with the goal of comparing rates and fees more intelligently. Comparisons based solely on rates and fees leave out the wider context of a utility’s financial health, customer base, geographic features, regulations, and other factors that affect whether utilities can provide services safely, affordably, and sustainably. Each local entity is different, and stormwater in particular has more local variables than water and wastewater in many ways. Though we strive to accurately model all of these differences, there will always be some shortcomings in the comparison process. Stormwater utilities vary widely in the level of service they provide, and that should be taken into account when using this tool.
It’s a whole new world for stormwater, and it’s about time. Let us know your thoughts on the new and improved Georgia Stormwater Fees Dashboard, and stay tuned for the North Carolina version later this year.


Leave a Reply