

Most national analyses of affordability utilize a small sample of utilities or make generalized assumptions about expenditures. With more than 3,000 utilities in our pricing database, the Environmental Finance Center at the University of North Carolina at Chapel Hill is uniquely positioned to conduct detailed analyses of affordability using multiple metrics. Historically, the most common method of presenting affordability metrics for a specific water utility is to calculate the percent of the median household income of a community that goes to pay for water and/or wastewater services on an annual basis. This metric, often presented in shorthand as percent MHI, is used by the US Environmental Protection Agency as a surrogate to establish the capacity of a community to pay for water services in general and to pay for services that will see cost increases due to regulatory requirements[1]. The recent affordability paper written by Elizabeth A. Mack and Sarah Wrase, and published by PLOS One that we mentioned in our previous blog post utilized this metric,[2] and we employ it as a measure in our own Affordability Assessment tool and our Rates Dashboards. This method involves calculating an average household’s bill, multiplying that bill by 12 to calculate an average annual bill, and then dividing the annual bill by the median household income to produce the annual bill as a percentage of Median Household Income. Below I have calculated the percent MHI for a water utility in our database.

Shadi Eskaf wrote a blog post in 2013 on some of the pitfalls and benefits of using Census data to calculate percent MHI. However, there are also two broader issues with percent MHI that are worth thinking about—aside from any issues with MHI as a statistical measure. The first is that the selection of the bill—the numerator in that calculation—matters quite a bit. As discussed in my previous post, water rates vary tremendously across the country. At any given consumption point, different utilities will charge very different rates. Furthermore, water usage varies from utility to utility, especially across different regions of the country. Drier areas of the country, such as the West and Southwest, tend to have higher average use than other regions.[3] Though this is not a major problem for a single utility that wishes to use percent MHI—as it would be relatively easy for them to use their own usage data to calculate an average bill—this issue is problematic when attempting to compare many different utilities across the country. Each utility will have both different rates and different average usage. While a national average bill can be useful for drawing conclusions about the country on average, it can be extremely difficult to apply such a bill to individual communities and utilities.
The second issue—which the remainder of this blog post will focus on—is the use of median household income as an indicator at all. By definition, half of the households in a community will have an income less than MHI. Because these households have smaller incomes than the median household, they potentially face much greater affordability challenges. Thus, using percent MHI on its own can obscure the affordability issues that low-income households face within a service area. If the goal of the affordability analysis is to understand whether a utility or community should focus on mitigating affordability, then using the percent MHI provides little insight compared to other more precise metrics. The American Water Works Association suggests highlighting the percent of income a household on the lower end of the spectrum would pay (twentieth percentile of income) as an alternative measure.[4] In our affordability assessment tool, the user can input census data for a variety of income buckets—from $0-$10,000 to $200,000 or more. The tool then calculates the average bill as a percentage of the upper limit of each of the buckets.
Another potential measure to use is what a family at the federal poverty threshold would pay. The poverty guidelines are simplified versions of the federal poverty thresholds, and are often used to determine eligibility for federal programs.[5] The formula for the poverty guidelines is relatively simple: The poverty line for a household of one person is an annual income of $12,060. Each additional member of a household raises the poverty line by $4,180.
To demonstrate this approach, we conducted an analysis using pricing data from our database, which utilized the value of $24,600 as the denominator in a second measure. This is equivalent to the poverty guideline for a household of four. We calculated the bill at 5,000 gallons for each water utility in our database—as a percentage of both MHI and as a percentage of $24,600. We plotted each of these values as a histogram—a chart that shows the frequency of a certain value, or range of values. For example, in the chart below 1,499 bills as a percentage of MHI were greater than 0.5 percent and less than or equal to 1.0 percent, and 551 bills as a percentage of $24,600 were greater than 0.5 percent and less than or equal to 1.0 percent.
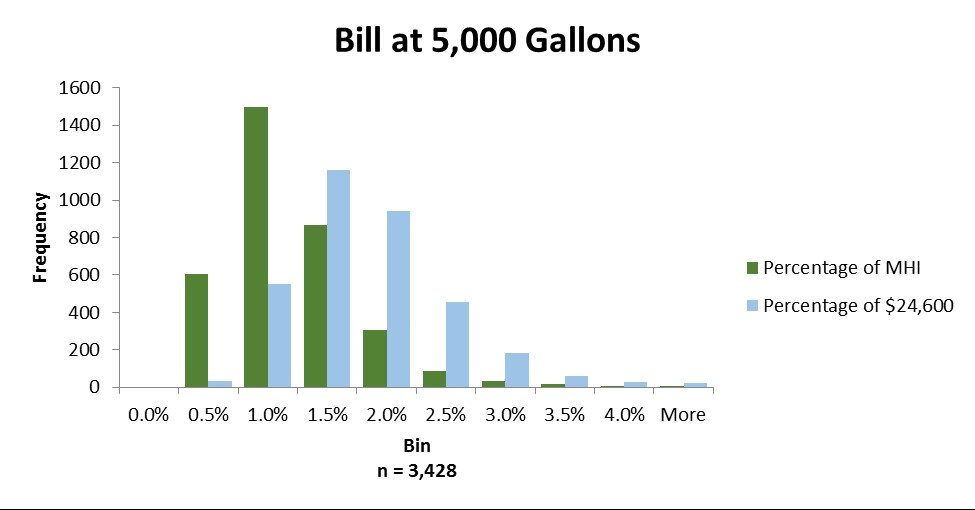
While the difference in presentation is driven by basic math, the visual and quantitative repercussions of this different approach are significant. Focusing on the percentage that the median household pays can leave the impression that the customer base pays relatively little for water. Shifting the analysis to the impoverished threshold highlights a more realistic percentage for the families likely to have the most affordability challenges. Only 4 percent of the utilities in our database have a bill at 5,000 gallons which is greater than 2 percent of MHI. In contrast, for more than 20 percent of the utilities in our database, a family of four at the poverty line would spend more than 2 percent of their income for 5,000 gallons of water. The point of this comparison is not to say that this new metric is the best way to measure the affordability of water, but that using percent MHI alone can obscure the problem—leading utility managers or regulators to believe that they do not have any affordability concerns. Relying on percent MHI can mask the hardships faced by families that are most at risk of facing affordability issues. The reality is that in many communities, households at the margins are likely to spend a significant amount of their income on water services. If this description fits your utility, check out some of our work on creating affordability programs, such as our state by state analysis of the legal framework for affordability programs and this blog post with examples of customer assistance programs.
Daniel Irvin is the EFC at UNC’s Environmental Finance Community Advisor. Daniel graduated from the University of North Carolina at Chapel Hill in May 2016. He majored in Public Policy and Philosophy with a minor in Environmental Studies.
[1] http://www.awwa.org/Portals/0/files/legreg/documents/affordability/AffordabilityAssessmentTool.pdf
[2] http://journals.plos.org/plosone/article?id=10.1371/journal.pone.0169488
[3] http://www.hamiltonproject.org/charts/domestic_water_use_per_capita_in_gallons_per_day_by_state_2005
[4] http://www.awwa.org/Portals/0/files/legreg/documents/affordability/AffordabilityAssessmentTool.pdf

If Poverty Line is a better indicator, is 5000 gallons per month the right number to use? What is the typical living situation for those living at the poverty level? Social Security/ Medicaid? Do these folks move to public assistance housing? Single parent families living in apartments? Do apartment dwellers use 5000 gallons per month? Point being most people living at the poverty level are not watering their yards or washing their cars and have numerous assistance programs that may reduce their need to cook, etc. I think we can agree that it is impossible to set an affordability metric that captures the whole picture. There is a benefit in using one and understanding its short comings.
The selection of the usage number is a great point. The average usage for a utility will include customers who water their lawns, have swimming pools, and have other use that might be considered discretionary. A utility that is studying the affordability of their rates might want to consider using a number based on essential water use as opposed to average use. The tricky part with that approach, is of course there is not uniform agreement as to what level of water use is “essential”. This is compounded by the fact that water efficient fixtures can allow a household to reduce water use without changing their behavior.
As to whether customers at the poverty line use less than 5,000 gallons, you give some good reasons as to why low-income customers will probably use less than the average customer in a given community. However, there are two circumstances in which it might not be the case. First, customers with large families will probably have higher levels of use even without watering their yards or washing their cars. Second, water-efficient fixtures can be expensive to purchase. Low-income customers might be less likely to have efficient showerheads, low-flow toilets, etc. The existence of these factors is an argument for affordability programs that assist customers in conservation, whether simply educating them on best practices to assisting in the purchase of water-efficient fixtures.