

The year 2010 marked the start of an unusual period in the water sector. For five years running, total capital outlays by local governments in the United States on water and wastewater infrastructure declined year after year. This period coincides with the Great Recession and towards the end of spending under the American Recovery and Reinvestment Act (ARRA). Yet infrastructure continued to age, and construction costs continued to rise at about 2.6 percent per year during that period. Have we finally come across a sign that capital expenditures on water and wastewater infrastructure may be growing again?
Tag: capital costs
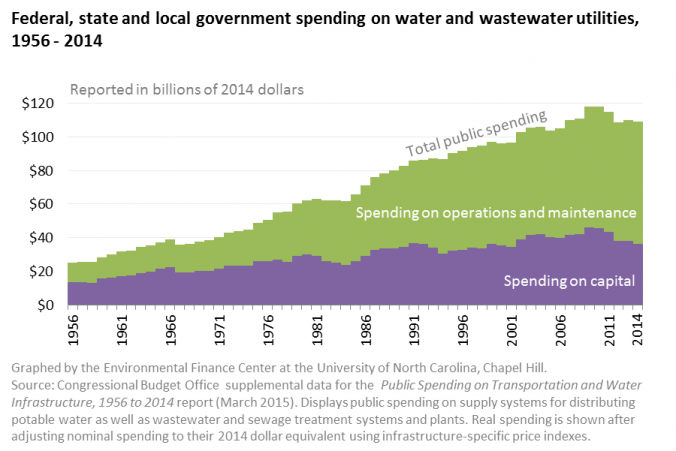
According to data collected and published by the Congressional Budget Office (CBO), federal, state and local governments in the United States spent more than $2.2 trillion in the last 59 years on operations, maintenance and capital infrastructure of water and wastewater utilities. That equates to more than $4,131,000,000,000 in 2014 dollars, adjusting for inflation of infrastructure-specific costs. Following our earlier blog post demonstrating that federal spending on water and wastewater utilities decreased since the 1980s, we analyzed the data and identified 4 more trends in how government spending on utilities changed between 1956 and 2014.
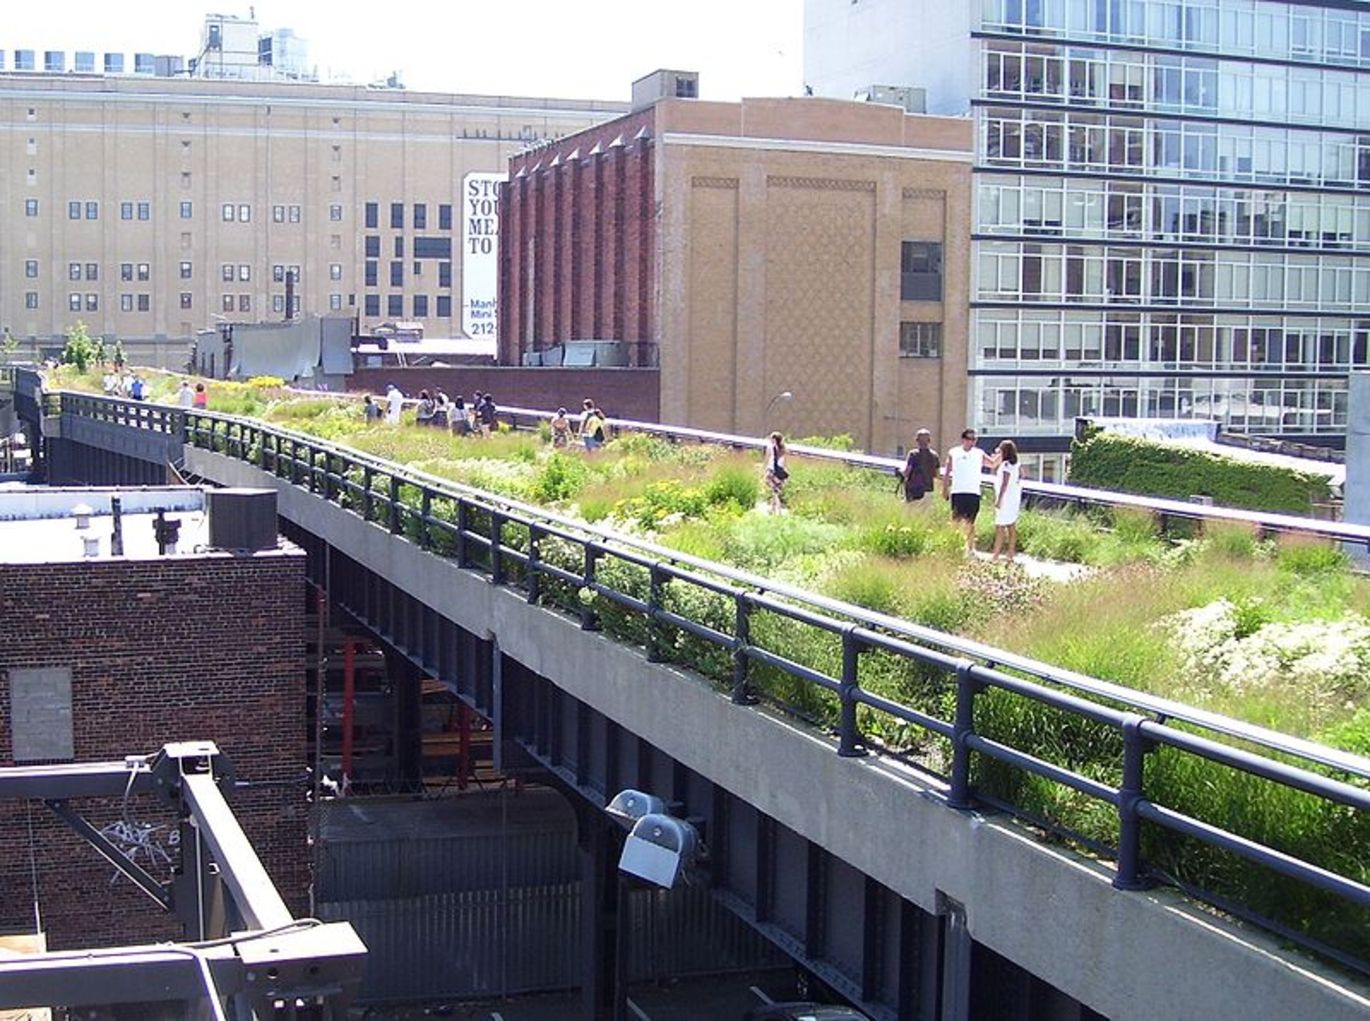
 As the green infrastructure (GI) approach to water management gains momentum, the budget process needs to adapt to some of the characteristics that make green distinct from the more traditional gray infrastructure approach. As communities are embarking on GI, shortcomings in the budgeting process can falsely create a bad first impression. When inaugural GI projects are grossly over budget for their installation, or need more frequent maintenance than planned, future GI projects may be blocked before the current project’s vegetation can become established enough to produce the significant benefits for which it was designed. However, considering and planning for certain key attributes of GI can fend off this negative cycle. Continue reading
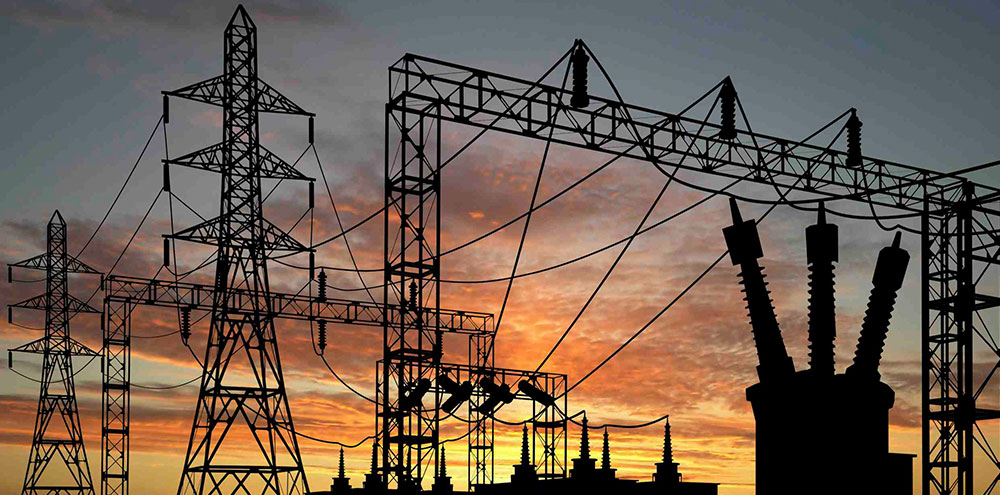
How financially healthy are the municipal residential electric utilities in North Carolina? That is a broad question, and one of keen interest to many customers of those utilities. This is especially true at a time when Duke Energy Progress and the North Carolina Eastern Municipal Power Agency (NCEMPA) are discussing the possibility of Duke Energy Progress purchasing NCEMPA’s electric generating assets, and where rate payers may be wondering what such a sale could mean for their future electric rates, as discussed in this previous blog post on affordability of residential electricity in N.C. Continue reading
Update: This blog post and the graph were updated on February 10, 2021 to reflect more recent price index estimates and trends.
Sitting at your desk very late in the afternoon, your coffee going cold, staring at a spreadsheet, crunching numbers for a Capital Improvement Plan. You’re ready to call it a day, but decide to do “just one more quick calculation” (you tell yourself). You glance over to the next cell, and you see it. It’s a simple question, but hundreds of thousands of dollars, maybe millions, hinge on it. “At what annual rate are your capital costs inflated into the future?” Do you have a good answer off the top of your head?

- The UNC EFC’s webinar on financial benchmarking tools for elected Maryland officials is TOMORROW from 1-3PM ET! Lea… https://t.co/dvrxpdrhl2
- @GEFAloan Information about the Georgia Rates Dashboard can be found here: https://t.co/N3ZMh6rEof
- REMINDER! Learn how to maintain long-term financial sustainability in this FREE webinar on May 31. Hosted by the UN… https://t.co/CIfHsyIuTj