
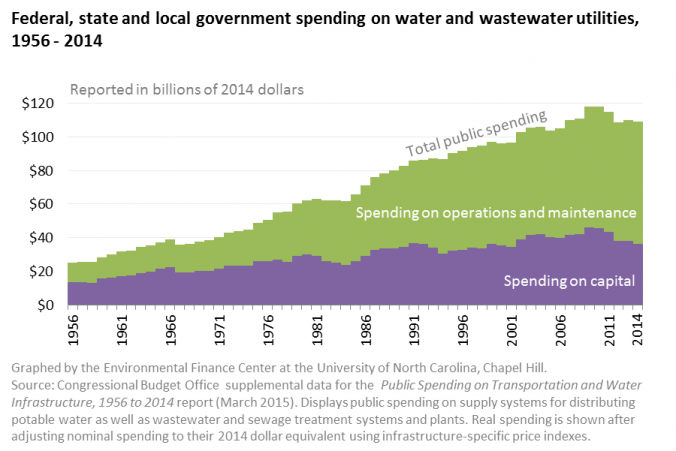
According to data collected and published by the Congressional Budget Office (CBO), federal, state and local governments in the United States spent more than $2.2 trillion in the last 59 years on operations, maintenance and capital infrastructure of water and wastewater utilities. That equates to more than $4,131,000,000,000 in 2014 dollars, adjusting for inflation of infrastructure-specific costs. Following our earlier blog post demonstrating that federal spending on water and wastewater utilities decreased since the 1980s, we analyzed the data and identified 4 more trends in how government spending on utilities changed between 1956 and 2014.
Tag: federal spending
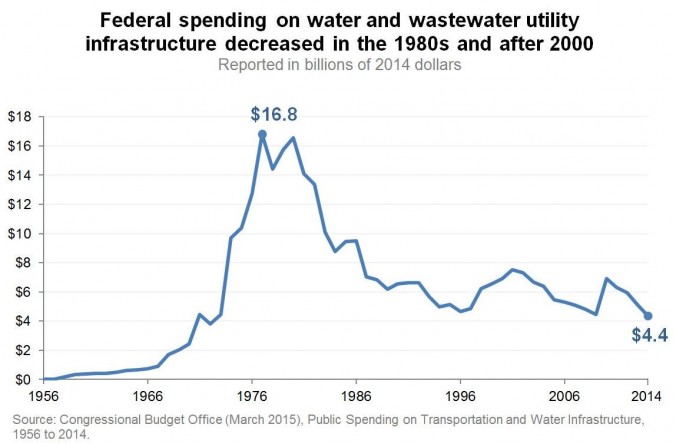
In honor of Infrastructure Week (May 11-15, 2015), we dug into a report published by the Congressional Budget Office (CBO) in March. Public Spending on Transportation and Water Infrastructure, 1956 to 2014 reports on trends in federal, state, and local government spending on infrastructure, using data acquired from the Office of Management and Budget (OMB). This graph illustrates the federal funding trends for water and wastewater utilities between 1956 and 2014, in 2014 dollars. Funding levels have decreased dramatically — nearly fourfold between 1980 and 2014. The consequence for communities nationwide is even more significant when considering that a majority of the federal funds in the 1970s and 1980s were provided as grants, while the majority of the funds provided since the 1990s have primarily been loans.
CBO’s report includes more detailed breakdowns on federal, state, and local spending on water and wastewater infrastructure. We published a blog post looking at four other trends in public spending on water and wastewater utilities. We also posted an Excel spreadsheet with the data here.

- The UNC EFC’s webinar on financial benchmarking tools for elected Maryland officials is TOMORROW from 1-3PM ET! Lea… https://t.co/dvrxpdrhl2
- @GEFAloan Information about the Georgia Rates Dashboard can be found here: https://t.co/N3ZMh6rEof
- REMINDER! Learn how to maintain long-term financial sustainability in this FREE webinar on May 31. Hosted by the UN… https://t.co/CIfHsyIuTj