
Figure 4: How do FY 2019 Residential Water and Wastewater SDFs Compare to the Utility’s FY 2015 Capacity Fee?
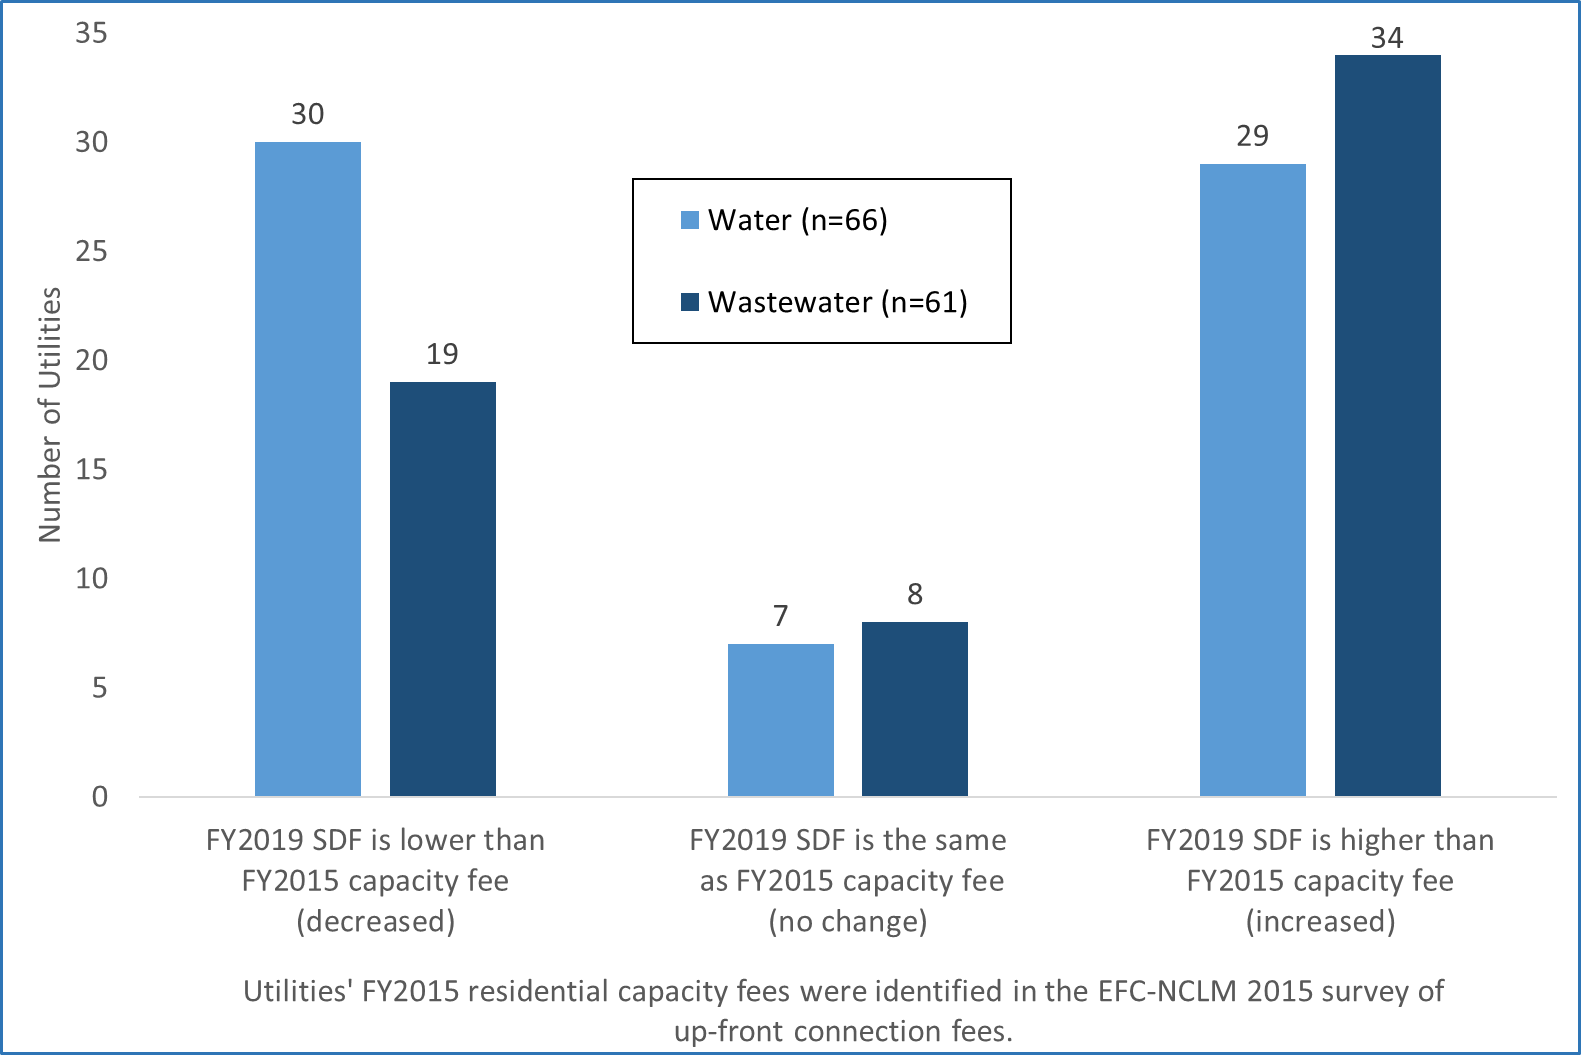
Figure 4: How do FY 2019 Residential Water and Wastewater SDFs Compare to the Utility’s FY 2015 Capacity Fee?
Knapp-Sanders Building Campus Box 3330, UNC Chapel Hill Chapel Hill, NC 27599-3330 T: 919 966 5381 | F: 919 962 065
© 2024 Environmental Finance Blog
Theme by Anders Noren — Up ↑
Leave a Reply