
How financially healthy are the municipal residential electric utilities in North Carolina? That is a broad question, and one of keen interest to many customers of those utilities. This is especially true at a time when Duke Energy Progress and the North Carolina Eastern Municipal Power Agency (NCEMPA) are discussing the possibility of Duke Energy Progress purchasing NCEMPA’s electric generating assets, and where rate payers may be wondering what such a sale could mean for their future electric rates, as discussed in this previous blog post on affordability of residential electricity in N.C. Continue reading
Tag: North Carolina (Page 3 of 5)
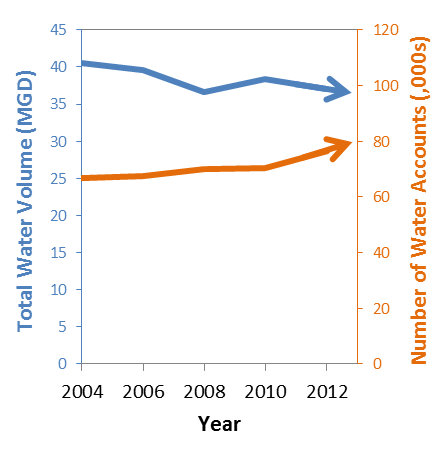

Almost two years ago, we wrote a blog post revealing that average residential water use is declining in the State of North Carolina. Similar trends have also been identified in other states and across the country, driven by several factors. It turns out; it’s not just average residential water use that is declining. Despite growing service populations, many utilities have noticed that total demand is falling.

David Tucker is a Project Director at the Environmental Finance Center at UNC Chapel Hill.
How affordable are electric rates for “average” or “typical” residential customers in North Carolina? That is a complicated question to answer, and this article represents only a beginning to that investigation. Continue reading
David R. Tucker is a Project Director at the Environmental Finance Center at the University of North Carolina at Chapel Hill.
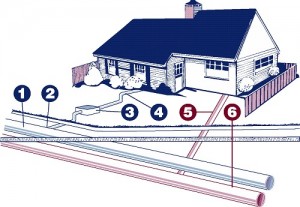
Key: 1. Water Main; 2. Water Tap; 3. Water Meter; 4. Private Plumbing (water line); 5. Private Plumbing (wastewater line); 6. Wastewater Main.
Source: City of Fort Worth, Texas
My work at the UNC Environmental Finance Center frequently centers around the study, benchmarking, and understanding of rates, especially residential rates: charges per unit across time (such as dollars per kilowatt hour for kWh of electricity used in a month; or dollars per gallon, for thousands of gallons of drinking water used in a quarter; and so on). You can see the results of our work on rates by yours truly and my colleagues in sophisticated tools that we have developed, such as our drinking water and wastewater rates dashboards, our stormwater rates dashboards, and our electric rates dashboards, among many other tools and reports that the EFC has created. Continue reading
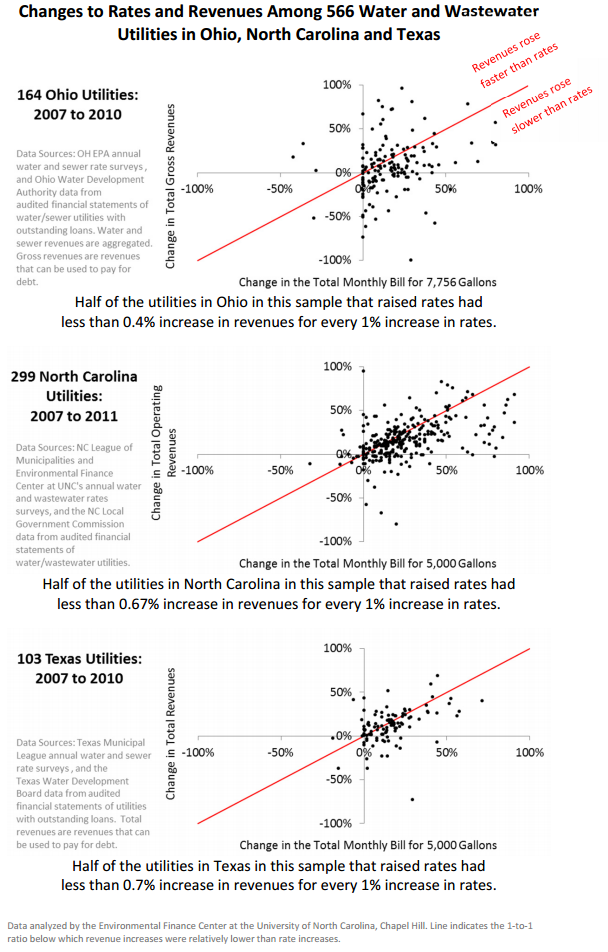
$napshot: Utility Rate Increases versus Revenue Increases
A $napshot is a graphic revealing an interesting environmental finance finding accompanied by a short post. This $napshot was created by Shadi Eskaf.

Changes to Rates and Revenues among 566 Utilities
While revenues usually rise as water and wastewater rates increase, revenues generally rise slower than rates. The graphs show how 566 utilities in three states changed rates over a three or four year period, and the subsequent change to annual revenues in the same time period. Four observations can be made. Continue reading