Author: Shadi Eskaf (Page 4 of 5)

SOG Environmental Finance Ctr

$napshot: Debt Service as Percent of Total Operating Revenues


Debt Service as Percent of Total Operating Revenues in FY2012

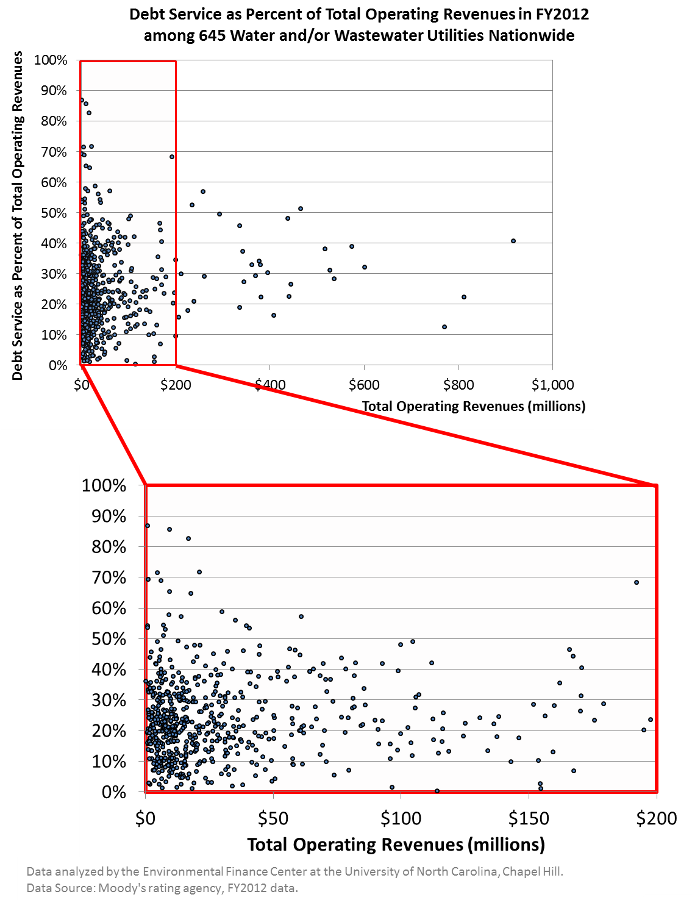
Last Thursday, while we were presenting one of two Water Research Foundation webinars (view recordings of the webcasts for free) on the financial strategies that water utilities have or can employ to improve revenue resiliency against changing financial trends, a participant on the webinar asked if we have any benchmarks on debt service as a percent of operating revenues. The graph above shows how debt service in FY2012 compared to the total operating revenues of 645 debt-paying water/wastewater utilities across the U.S. from Moody’s rating agency. 58% of the debt-paying utilities spent between 10% and 30% of their total operating revenues on debt service in FY2012. Only 11% of the utilities spent more than 40% of their revenues on debt service in that year. There does not seem to be a major distinction between small and large utilities in terms of the proportion of revenue spent on debt service. In our recently published WRF report, Defining A Resilient Business Model for Water Utilities, we showed that this proportion of debt service to operating revenues remained relatively steady between FY2003 and FY2012, despite declining water use. Spending a quarter of annual operating revenues on debt service requires careful financial planning on behalf of the utility since debt service is a fixed cost that must be paid regardless of fluctuating water sales and revenues. These findings are part of the research for Water Research Foundation project #4366.

A $napshot is a graphic revealing an interesting environmental finance finding accompanied by a short post. This $napshot was created by Shadi Eskaf.

$napshot: Utility Rate Increases versus Revenue Increases

A $napshot is a graphic revealing an interesting environmental finance finding accompanied by a short post. This $napshot was created by Shadi Eskaf.

Changes to Rates and Revenues among 566 Utilities

Changes to Rates and Revenues among 566 Utilities

While revenues usually rise as water and wastewater rates increase, revenues generally rise slower than rates. The graphs show how 566 utilities in three states changed rates over a three or four year period, and the subsequent change to annual revenues in the same time period. Four observations can be made. Continue reading

Water Rate Increases Among 1,961 Utilities in Six States in the Last Decade

Shadi Eskaf is a Senior Project Director for the Environmental Finance Center at the University of North Carolina, Chapel Hill.

Rising rates image

Our research shows that water rates have been rising faster than CPI inflation in the past few years for hundreds of utilities, particularly after the financial crisis. In some states, however, there were also many utilities whose rates failed to keep pace with inflation.

From a rate-setting perspective, utilities that raised rates more frequently had a double advantage over utilities that raised rates only occasionally or rarely. First: the average annual rate increase was lower than the one-time rate increases of utilities that occasionally raised rates, reducing the rate shock that customers experienced when rates rose. Second: despite the lower average rate increases, utilities that raised rates more frequently accumulated, on average, a larger total increase in rates in a five-year period than utilities that raised rates only occasionally.

Continue reading

Trends in Operating Expenses Relative to Operating Revenues for Local Government-Owned Water Utilities

Shadi Eskaf is a Senior Project Director for the Environmental Finance Center at the University of North Carolina, Chapel Hill.

Ratio of Operating Revenues to Operating Expenses for 62 Utilities Nationwide

Ratio of Operating Revenues to Operating Expenses for 62 Utilities Nationwide

A couple of months ago, we blogged that water utilities’ operating revenues are generally continuing to grow every year, but that there was a slowdown of revenue increases in recent years, particularly after 2008. At the same time, expenses are also rising. Does this mean that expenses have caught up to revenues and that the majority of utilities are now experiencing revenue shortfalls?

Continue reading

Are operating revenues declining for local government-owned water utilities? Evidence from six states.

Shadi Eskaf is a Senior Project Director for the Environmental Finance Center at the University of North Carolina.

Previous blog posts (here and here) discussed the fact that per capita water consumption is declining. The financial ramifications can be significant, since charges for customer sales constitute the single largest source of revenue for water utilities. Has the downward trend in water consumption translated into declining revenues for utilities? Anecdotally, we have heard from several utilities in Canada and the United States that the decline in water use has caused revenues to fall short of projections in recent years. Analyzing how revenues for 2,838 utilities changed from one year to the next in six states spread across the United States helps answer the question of whether revenues are declining.
Continue reading

« Older posts Newer posts »