Category: Smart Management for Small Water Systems (Page 5 of 10)

Finding Money in the Water System Budget: Energy Savings Performance Contracting (ESPC)

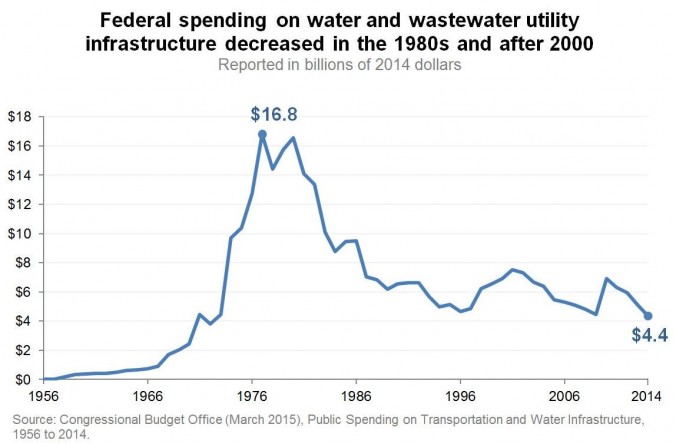
The way that drinking water and wastewater systems pay for energy improvements in the United States is changing – including for small drinking water systems (serving 10,000 or fewer people). As has often been mentioned on the EFC’s blog, the days of huge federal grants for construction of water and wastewater systems are long past. Since an energy improvement is a kind of capital improvement, there are many ways to pay for such projects: cash savings (e.g. through a utility’s capital improvement fund); loans (state revolving fund loans or bank loans); issuing bonds (if you are a local government entity); internal energy revolving funds; and more. But coming up with the initial capital through one of the aforementioned means can be challenging.

Continue reading

Five Dangerous Financial Myths for Small Water Systems

Small water systems serving 10,000 people or less comprise more than 94% of our nation’s public water systems. They are a large and diverse group, and are managed by a wide variety actors – from local and tribal governments, to mobile home park owners, to homeowners associations, to shopping mall operators and hotel managers. These managers often have many other, very different responsibilities and often face challenges in running the water system. In 2011, 25 percent of the nation’s smallest systems violated health-based standards in part due to their geographic isolation, small staff size, growing infrastructure needs and small customer bases. And as we wrote about earlier this year, small water systems with financial difficulties are more likely to have violations.

Since 2012, the Environmental Finance Center at UNC and the Environmental Finance Center Network have been working to help educate and build financial and managerial capacity within small water systems. Through our work under the Smart Management for Small Water Systems Project, we’ve noticed 5 dangerous myths in financial planning. These myths can appear wherever water system planning occurs, but seem to be most prevalent among smaller communities that are considering creating a new or significantly expanded water system.

Continue reading

Key Financial Indicators for Water and Wastewater Systems: Days of Cash on Hand

In previous posts, we outlined how to use the financial statements of a water or wastewater system to calculate the key financial indicators of operating ratio (a measure of self-sufficiency) and debt service coverage ratio (a measure of a system’s ability to pay its long-term debts). Another key financial indicator is days of cash on hand.

Days of cash on hand is a measure of a system’s financial security. In essence, this is how much cash a system has saved up that isn’t earmarked for anything else (unrestricted cash) and estimates the number of days the system can pay its daily operation and maintenances costs before running out of this cash. This is obviously a worst-case scenario—it estimates how long a system can run if it receives no additional revenue, but it is a helpful measure of how long a system can operate if it has a sudden and dramatic reduction in operating income, perhaps from a large customer leaving or from mandatory restrictions due to drought conditions.

Continue reading

$napshot: Federal Funding Trends for Water and Wastewater Utilities (1956-2014)

In honor of Infrastructure Week (May 11-15, 2015), we dug into a report published by the Congressional Budget Office (CBO) in March. Public Spending on Transportation and Water Infrastructure, 1956 to 2014 reports on trends in federal, state, and local government spending on infrastructure, using data acquired from the Office of Management and Budget (OMB). This graph illustrates the federal funding trends for water and wastewater utilities between 1956 and 2014, in 2014 dollars. Funding levels have decreased dramatically — nearly fourfold between 1980 and 2014. The consequence for communities nationwide is even more significant when considering that a majority of the federal funds in the 1970s and 1980s were provided as grants, while the majority of the funds provided since the 1990s have primarily been loans.

CBO’s report includes more detailed breakdowns on federal, state, and local spending on water and wastewater infrastructure. We published a blog post looking at four other trends in public spending on water and wastewater utilities. We also posted an Excel spreadsheet with the data here.

« Older posts Newer posts »